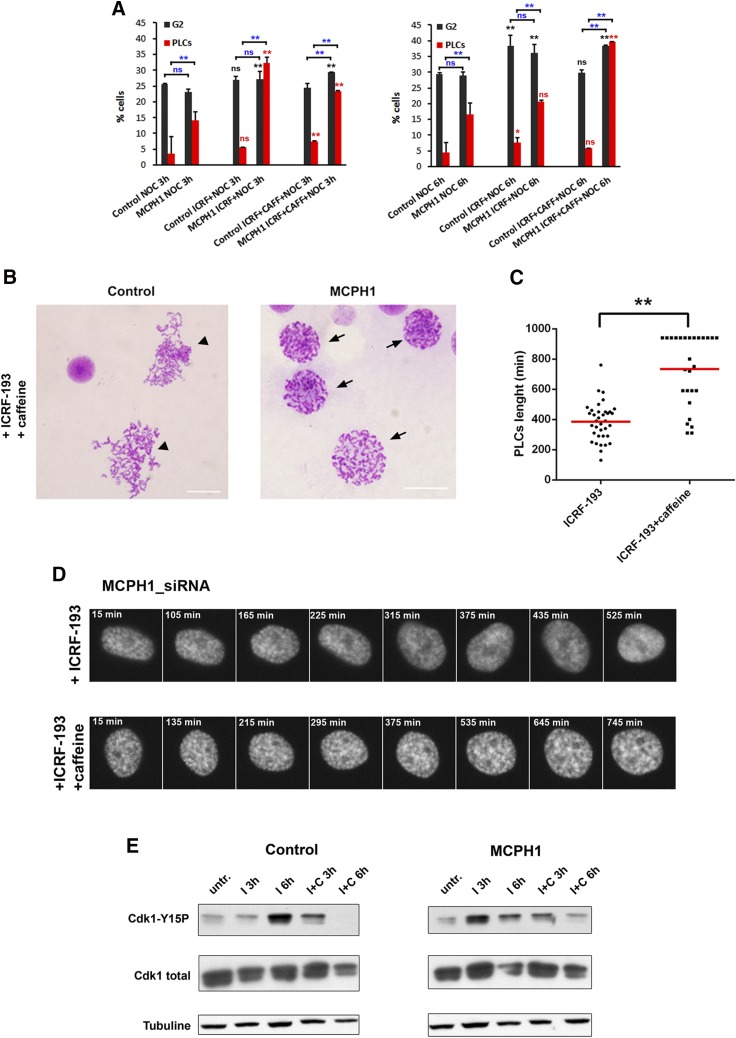
Figure 3.
A) Percentage of PLCs and G2 cells in control and MCPH1 lymphoblastoid cells observed after either 3 h (left) or 6 h (right) with the indicated treatments. PLCs were determined by microscopic analysis of cytogenetic preparations prepared simultaneously from the same samples shown in Fig. 1. More than 500 cells were scored per sample. G2 fraction was obtained by flow cytometry. Mean and range (bars) data from 2 independent experiments are presented. For each time point, pooled data for each treatment were compared independently in control and patient cells by c2 test of independence to nocodazole-treated cells. Furthermore, for each treatment and time point, control and patient data were pairwise compared by c2 test of independence (underlined). *P < 0.01, **P < 0.001. B) Representative images from cytogenetic preparations of control and MCPH1 cells treated simultaneously with ICRF-193 and caffeine. Arrows point to PLCs, a cellular phenotype characteristic of MCPH1 lack of function that is defined by visible chromosome condensation and intact nuclear envelope. Arrow heads point to cells with tangled, unresolved, and uncondensed chromosomes, characteristic of cells entering mitosis without topo II function. Scale bars, 5 μM. C) Box-plots showing the time (in minutes) that PLCs from MCPH1-siRNA–treated HeLa cells required to completely decondense their chromosomes after adding ICRF-193 alone or combined with caffeine. The red line indicates the mean value. Thirty PLCs were monitored. Statistical comparisons for the mean and median data were done by Student’s t and Wilcoxon tests, respectively. **P < 0.01. D) Selected frames showing the condensation dynamics of MCPH1-siRNA–treated HeLa cells while incubated with ICRF-193 alone or combined with caffeine as explained in Fig. 2A. Note that the PLC phenotype of the cells, visible from the first frames, is progressively reduced in ICRF-193–treated but not in ICRF-193– and caffeine-treated cells. Time from caffeine addition is indicated in minutes. I, ICRF-193; C, caffeine; ns, nonsignificant; untr., untreated. E) Immunoblot analyses of CDK1 levels in control and MCPH1 cells after incubation with ICRF-193 or combined with caffeine.

