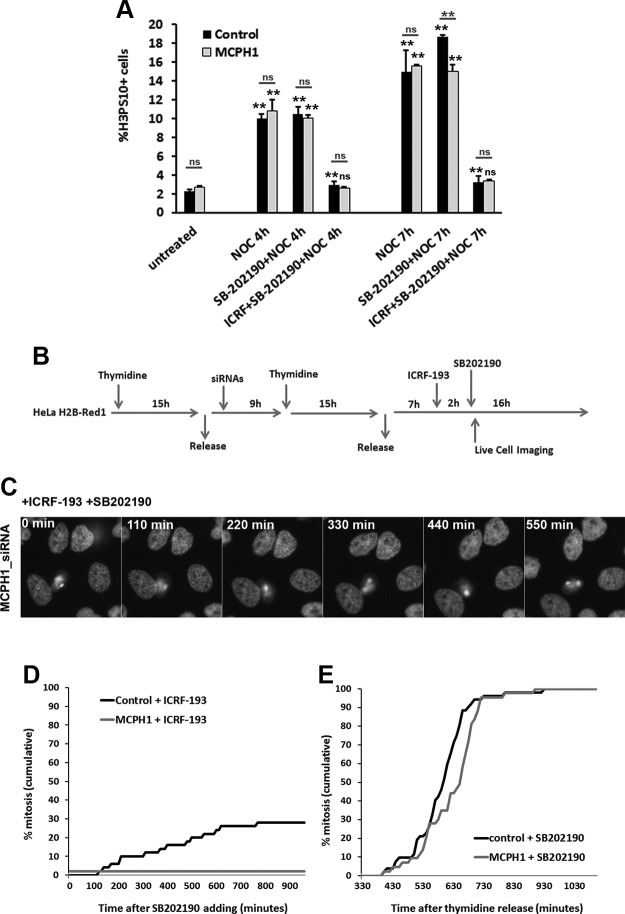
Figure 4.
A) Frequency of histone H3PS10–positive cells in control and MCPH1 cells determined by flow cytometry after incubation with nocodazole alone or combined with either SB202190 or SB202190 and ICRF-193 for the indicated time points. Mean and range (bars) data from 2 independent experiments are presented. For each time point, pooled data for each treatment were compared independently in control and patient cells by χ2 test of independence to untreated cells. Furthermore, for each treatment and time point, control and patient data were pairwise compared by χ2 test of independence (underlined). B) Experimental procedure employed in HeLa H2B-Red1 cells to monitor cell cycle progression by live-cell microscopy after incubation with ICRF-193 and SB202190. C) Selected frames showing the cell cycle dynamic of MCPH1 siRNA–treated HeLa cells while incubated with ICRF-193 and SB202190. Time from SB202190 addition is indicated in minutes. D) Cumulative frequency chart showing the timing (in minutes) of mitosis onset for cells transfected with either control scrambled or MCPH1 siRNAs and treated as explained in B. Time after SB202190 addition is shown. At least 50 cells were analyzed in each case. Cells treated under the same conditions but without adding siRNAs to the transfection mixture showed similar cell cycle dynamics to the scrambled siRNA–transfected cells (unpublished results). E) Cumulative frequency chart showing the timing (min) of mitosis onset after single incubation with SB202190. Time after release from the second thymidine block is shown. SB202190 was added 300 min after the release. Control cells were treated under the same conditions as MCPH1-siRNA–treated cells but without adding siRNAs to the transfection mixture. At least 50 cells were analyzed in each case. Note that all cells were later arrested in mitosis as a consequence of p38 inhibition. NOC, nocodazole; ns, nonsignificant. **P < 0.001.

