Figure 6.
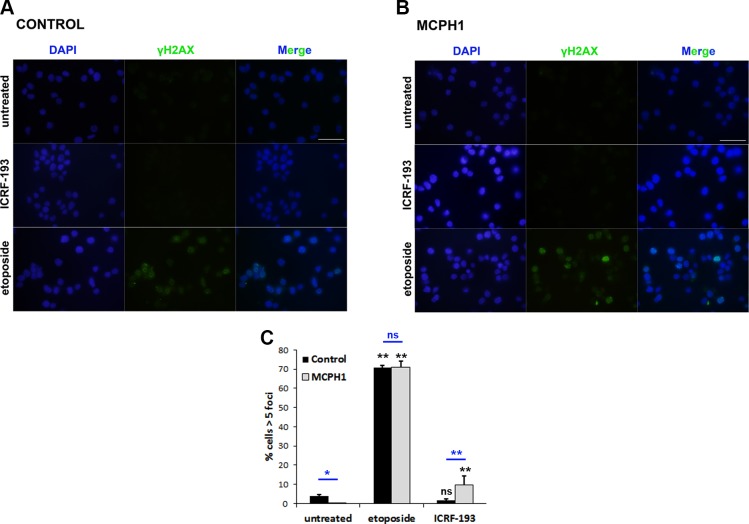
A, B) Representative images from immunofluorescence analyses using an antibody against γ-H2AX (MilliporeSigma) in proliferating lymphoblasts from control (A) and MCPH1 cells (B) treated with either DMSO (untreated), ICRF-193, or etoposide. Scale bars, 5 μM. C) Fraction of cells containing more than 5 γ-H2AX foci from the described analyses in A, B. At least 200 cells from 2 independent experiments were counted; mean and range (bars) data are presented. Pooled data for each treatment were compared independently in control and patient cells by χ2 test of independence to untreated cells. Furthermore, for each treatment, control and patient data were pairwise compared by χ2 test of independence (underlined). Ns, nonsignificant. *P < 0.01, **P < 0.001.

