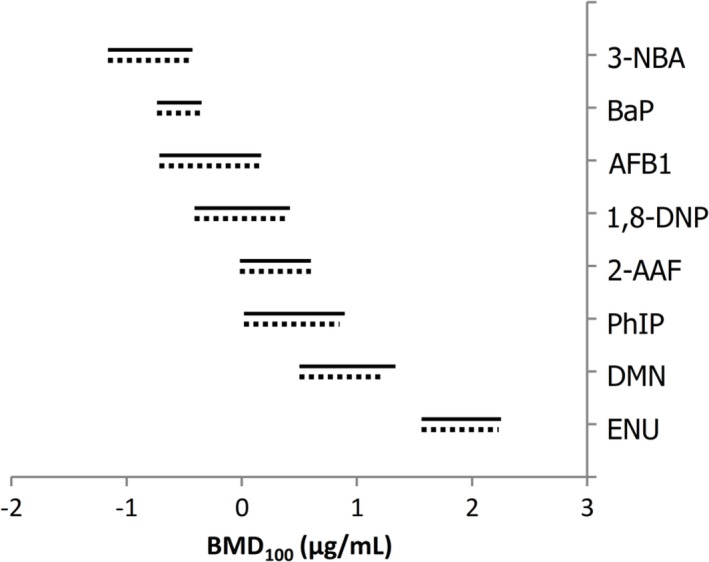
Figure 5.

Benchmark dose (BMD) values (i.e., BMD100) with two‐sided 90% confidence intervals generated using BMD covariate analysis of MutaMouse primary hepatocyte (PH) mutant frequency (MF) dose–response data. BMD analysis was only conducted for agents shown to elicit significant positives responses. Solid lines represent the fitted exponential model, whereas dotted lines represent the Hill model.
