
Figure 3.
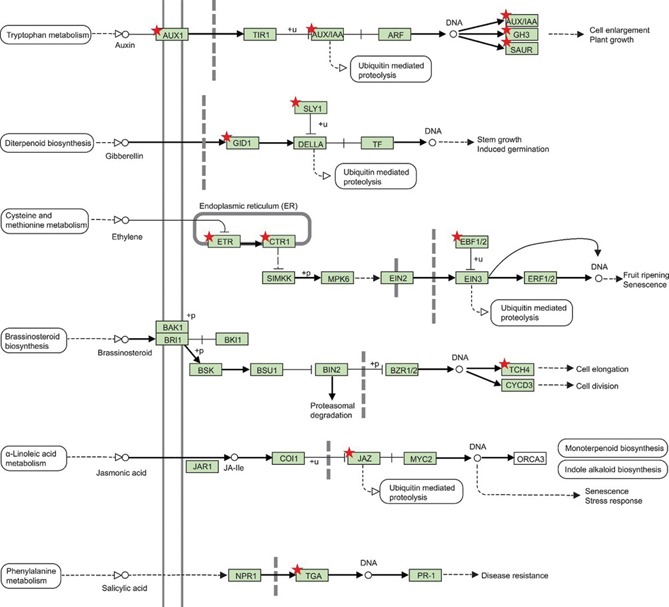
KEGG enrichment analysis (DAVID) of the genes downregulated upon PAC treatment (fold change < −2 and FDR < 0.05) The model depicts the signaling pathway of multiple plant hormones. The red stars indicate downregulated genes upon PAC treatment of C. limon seeds.