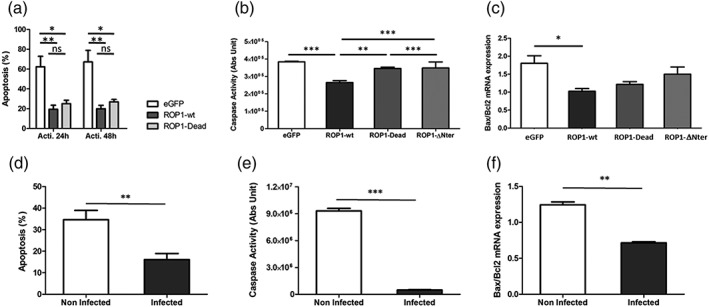
Figure 5.

EtROP1 inhibits host cell apoptosis. (a) Annexin V‐PE quantification by FACS analysis of HEK293T cells transfected with EtROP1‐GFP expression plasmids (wt and dead forms) or the control plasmid pcDNA‐GFP. Two days posttransfection, cell apoptosis was induced by actinomycin D. After 24 hr or 48 hr postapoptosis induction, Annexin V‐PE and efluor780 staining were performed and GFP positive cells (transfected cells) were flow cytometry sorted. Apoptotic cells (Annexin V‐PE stained) were quantified. Necrotic cells were stained by efluor780 and excluded from the analysis. Global ANOVA analysis was significant for EtROP1 constructs (p < .0001). Different means between pairs of sample groups were analysed by a two‐way ANOVA. (b) Caspase 3/7 activity in HEK293T cells transfected with EtROP1‐GFP expression plasmids (wt and dead forms) or the control plasmid pcDNA‐GFP. Two days posttransfection, GFP positive cells (transfected cells) were flow cytometry sorted and the caspase activity measured using the fluorogenic z‐DEVD caspase 3/7 substrate and a Glomax photometer. ANOVA analysis was significant (p < .0001). Different means between pairs of sample groups were analysed by a Newman–Keuls Multiple Comparison Test. (c) Bax/Bcl2 gene expression quantified by RT‐qPCR in HEK293T cells transfected with EtROP1‐GFP expression plasmids (wt and dead forms) or the control plasmid pcDNA‐GFP. Two days posttransfection, GFP positive cells (transfected cells) were flow cytometry sorted for subsequent total RNA purification. Gene expression values were normalised to the human housekeeping β‐actin and GAPDH transcripts. Values are expressed as fold increase versus non transfected cells. Different means between pairs of sample groups were analysed by a one‐way ANOVA. (d) Annexin V‐PE quantification by FACS analysis of epithelial cells from caeca infected with mCherry E. tenella recombinant strain. Eighty‐four hours postinfection, Annexin V‐PE and efluor780 staining were performed and mCherry positive cells (infected cells) were flow cytometry sorted. Analysis was run as mentioned in 5A legend. (e) Caspase 3/7 activity in epithelial cells from caeca infected with mCherry E. tenella recombinant strain. Analysis was run as mentioned in 5B legend. (f) Bax/Bcl2 gene expression quantified by RT‐qPCR in epithelial cells from caeca infected with mCherry E. tenella recombinant strain. Gene expression values were normalised to the avian housekeeping β‐actin, G10, and GAPDH transcripts. Values are expressed as fold increase versus non infected epithelial cells. Different means between samples were analysed by a one‐way ANOVA
