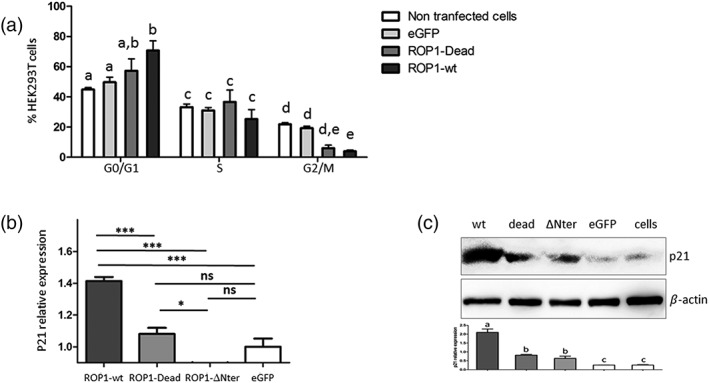
Figure 6.

EtROP1 induces G0/G1 cell cycle arrest in HEK293T cells. (a) Cell cycle distribution of HEK293T cells nontransfected (NT cells), transfected with the control plasmid pcDNA‐GFP (GFP) or with EtROP1‐GFP expression plasmids (wt and dead forms). Two days posttransfection, GFP positive cells (transfected cells) were flow cytometry sorted using propidium iodide staining to assess the percentage of cells in each phase (G0/G1, S, G2/M). Data represent the average from three independent experiments. Differences in cell cycle phases between sample groups were analysed by a chi‐squared test. Different letters refer to different statistical groups. (b) p21 gene expression determined by RT‐qPCR in HEK293T cells transfected with EtROP1‐GFP expression plasmids (wt and dead forms) or the control plasmid pcDNA‐GFP. Two days posttransfection, GFP positive cells (transfected cells) were flow cytometry sorted for subsequent total RNA purification. Gene expression values were normalised to the human housekeeping β‐actin and GAPDH transcripts. Values are expressed as fold increase versus pcDNA‐GFP transfected cells. Different means between pairs of sample groups were analysed by a one‐way ANOVA. (c) Western blot analysis showing p21 detection in HEK293T cells transfected with EtROP1‐GFP expression plasmids (wt and dead forms) or the control plasmid pcDNA‐GFP. Two days posttransfection, GFP positive cells (transfected cells) were flow cytometry sorted before immunoblot analysis to detect p21. An anti‐β‐actin antibody was used as an internal standard. Western blot signal were quantified by densitometry and ImageJ. Different letters refer to different statistical groups
