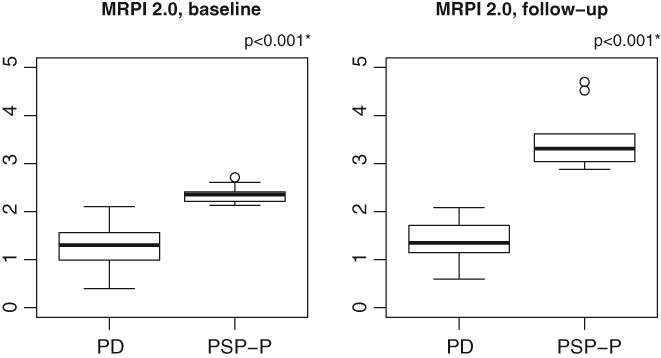
Figure 1.

Box plots of baseline and follow‐up Magnetic Resonance Parkinsonism Index 2.0 (MRPI 2.0) measurements in patients who maintained diagnosis of Parkinson's disease at the end of follow‐up (PD) and in those who developed clinical signs of progressive supranuclear palsy‐parkinsonism during the follow‐up (PSP‐P). Vertical solid lines (whiskers) show lower and upper values. Box stretches from lower hinge (25th percentile) to upper hinge (75th percentile). The median is shown as a line across each box. *Two‐sample t test with Bonferroni correction.
