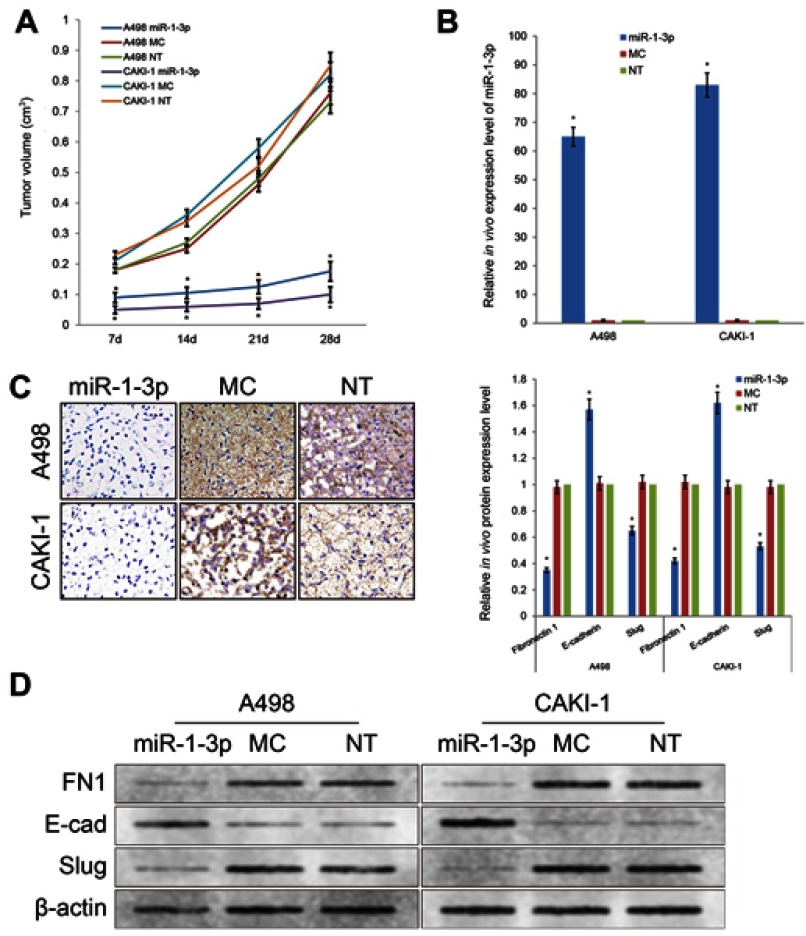
Figure 7.
(A) Upregulation of miR-1-3p repressed the growth of A498 and CAKI-1 RCC cell xenograft models. (B) Expression level of miR-1-3p in xenograft tumors of nude mice evaluated by RT-PCR assay. (C) Expression level of Fibronectin 1 in xenograft tumors observed by immunohistochemistry staining. (D) Protein expression levels of Fibronectin 1, E-cadherin or Slug in xenograft tumors of nude mice evaluated by Western blotting assay (n=6, *P<0.01 vs Non-Transfected groups). (The first panel of (C and D) are representative illustration of the results).

