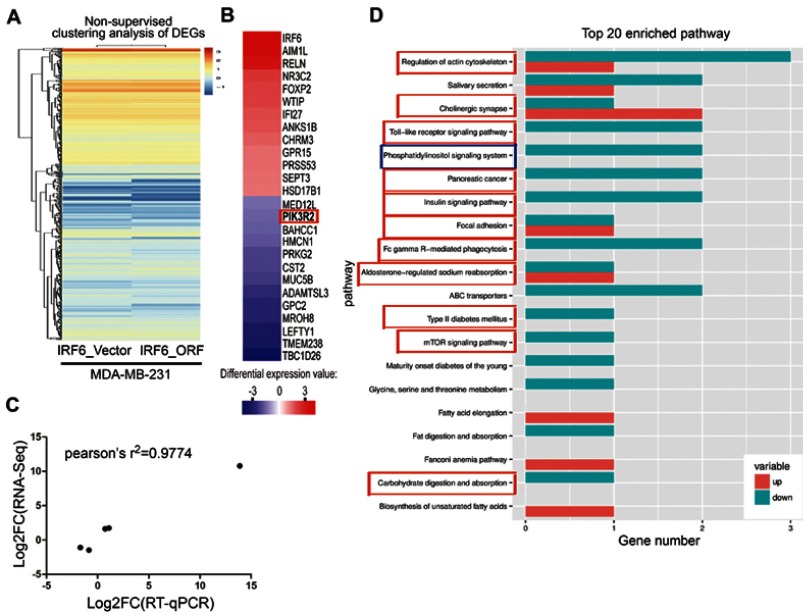
Figure 4.
RNA-Seq and KEGG analysis revealed IRF6 downregulates the expression of the PIK3R2 gene, a PI3K regulatory subunit that is comprehensively involved in many cancer-related signaling pathways. (A) Non-supervised clustering of all DEGs. The heatmap represents the mRNA K-means clustering of log10-transformed expression value differences between IRF6-overexpressing and vector cells. Red represents increased expression, and blue represents reduced expression. (B) Gene expression profiling was performed on IRF6overexpressing and vector cells lines. Here presentation of part of the distinctly upregulated and down-regulated genes in IRF6-overexpressing cell lines relative to the vector cell lines. Red, the gene has increased expression in IRF6-overexpressing cell lines compared to the vector cell lines. Blue, the gene has decreased expression. The red box indicates the gene PIK3R2 (p85β). (C) A scatter diagram including RNA-Seq and RT-qPCR data from correlation analysis including 5 genes: IRF6, PIK3R2, NR3C2, CST2, FOXP2. Pearson’s analysis, r2=−0.9774; p=0.0015. (D) Pathway analysis showed that 20 pathways were dramatically enriched; the numbers for each pathway were based on Fisher’s exact test, indicating the fold enrichment. The red outline box indicates that the gene PIK3R2 (p85β) participated in the corresponding pathway, such as regulation of actin cytoskeleton, cholinergic synapse, toll-like receptor signaling pathway, and phosphatidylinositol signaling system. The blue outline box indicates the phosphatidylinositol signaling system, which contains the PI3K/Akt signaling pathway.

