
Figure 1.
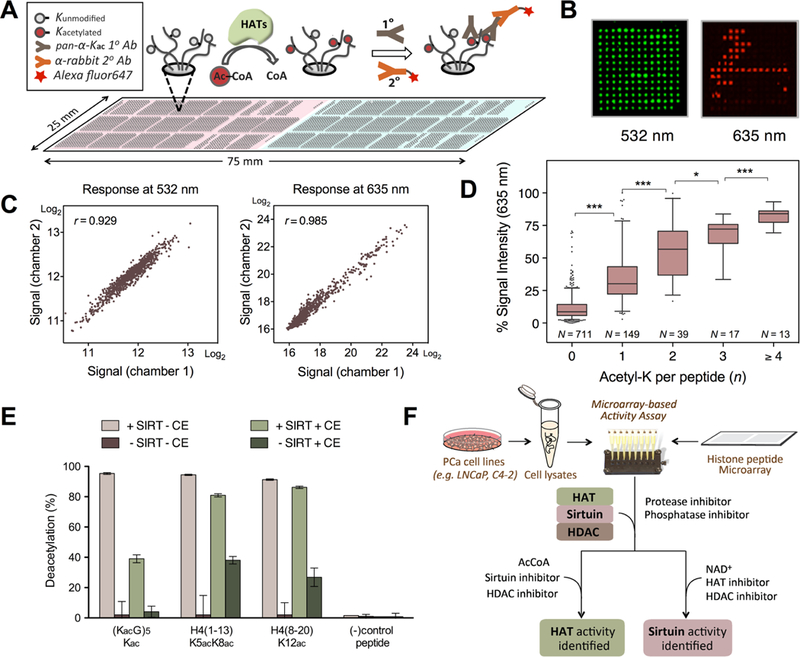
Histone (de)acetylation activity assay on a peptide microarray platform. (A) The assay scheme represents HAT-dependent lysine acetylation monitored by an immunoassay using the anti-pan-Kac antibody. A duplicate set (represented by pink and light turquoise) of 932-peptide libraries is each probed with a different cell lysate, separated by a duplex chamber. (B) Cy3-cellulose dye in peptide stock solution is used as a spot tracer and fluoresces at 532 nm (green), while acetylated lys (Kac) that binds with Alexa Fluor647-conjugated antibody fluoresces at 635 nm (red). Each peptide is printed in triplicate for statistical analysis. (C) A scatter plot of signals from peptides in two separately incubated subarrays at 532 nm and at 635 nm each respectively exhibits high correlation and intra-array concordance. (D) A box-and-whisker plot of % signal intensity at 635 nm across the peptide library at varying numbers of Kac (n). The whiskers represent 95% confidence intervals, while the outliers are shown as dots. The lower and upper lines of the boxes show the quartile range with a center cross line representing a median at n = 0 (median, M = 8.6, population, N = 711), 1 (M = 30.2, N = 149), 2 (M = 56.7, N = 39), 3 (M = 72.2, N = 17), and ≥4 (M = 84.0, N = 13). Statistical significance of signal intensity between each group is shown (*0.01 < P ≤ 0.05; **0.001 < P ≤ 0.01; ***P ≤ 0.001). (E) Deacetylation activity is measurable in a small pilot microarray. In the absence of recombinant sirtuin cocktail (Sirt1–3) and HEK293T cell extracts (CE), deacetylation activity is almost negligible (brown), while addition of sirtuins removed most of the acetyl mark (pink, pistachio). Addition of CE with the sirtuin cocktail led to some inhibition of deacetylation activity (pistachio), while CE in the absence of sirtuin supplementation revealed deacetylation up to 40% (dark olive). (F) Microarray-based assay scheme used in this study for identification of HAT and sirtuin activity.