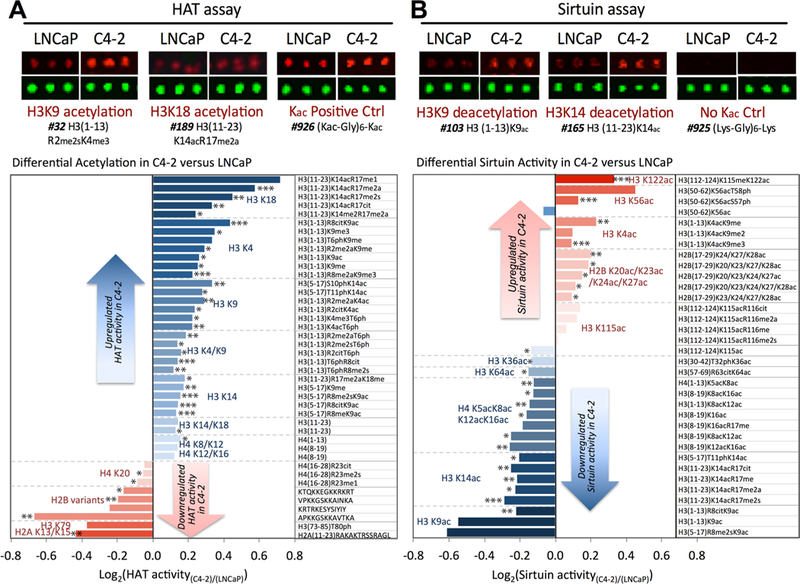
Figure 2.

Differential activity profiles of HAT and sirtuin against histone peptides in C4–2 versus LNCaP. (A) In the global HAT activity assay, cell lysate of LNCaP or C4–2 was added to each subarray chamber in the presence of acetyl-coA, TSA, and nicotinamide. Shown here is a snapshot of a triplicate peptide spots after a HAT assay. The Alexa Fluor647 signal (red) became more intensive when peptides with either H3K9 or H3K18 residue were incubated with C4–2 in a HAT activity assay compared to with LNCaP. Peptides with preacetylated lysine (#926) did not show changes in the signal. The peptides with most differential HAT activity are shown in the table in the decreasing order of Kac signal. Increased acetylation in C4–2 was observed at several lysine sites, most prominently at H3K18, H3K4, H3K9, and H3K14. Statistical significance was calculated for each microarray slide, and experiments were performed in triplicate. Each peptide with p < 0.05 was labeled with *, **, or *** to denote significance of p < 0.05 in one, two, or three microarray experiments. (B) Sirtuin activity was monitored after incubation with NAD+, anarcardic acid, TSA, and cell lysates from either LNCaP or C4–2. The loss of Kac fluorescent signal due to deacetylation on the peptides H3K9ac (#103) or H3K14ac (#165) was lower (i.e., higher Kac signal) with C4–2 as shown in the snapshot. Peptides with the highest differential deacetylation activity were summarized in the table with higher differences in peptides harboring acetylation at H3K9, H3K14, and H4K5/K8/K12/K16. Lower Kac signals were detected at peptides with acetylation at H3K122, H3K56, and H3K4. In both acetylation and deacetylation profiles, a blue bar indicates higher Kac in C4–2 (CR) compared to LNCaP (HS), while a red bar indicates decreased Kac signal in C4–2 versus LNCaP. The column on the right represents the position of the peptide sequence within histone and the PTM mark introduced. Statistical significance was calculated as in A.
