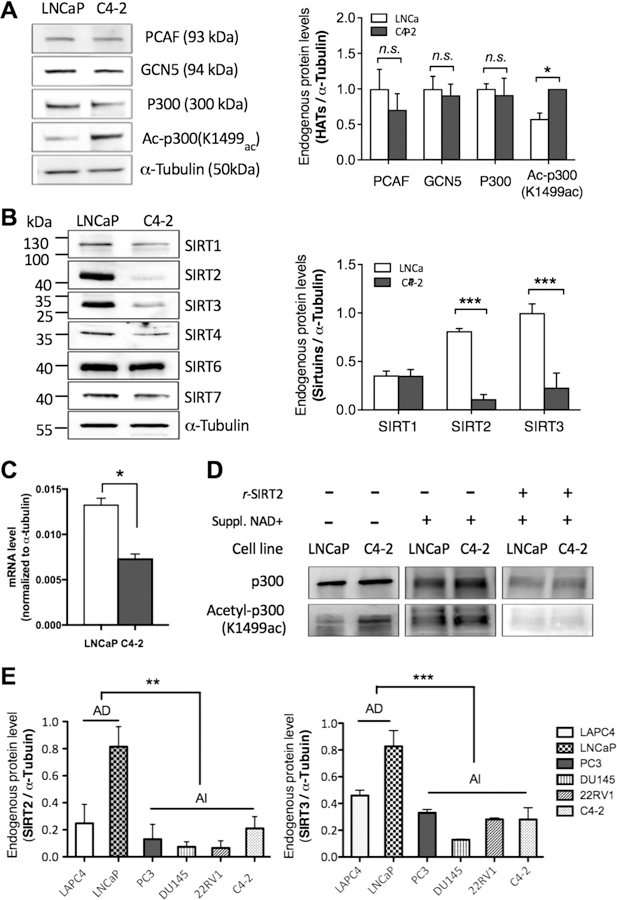
Figure 4.

Endogenous protein and gene expression levels against HATs and sirtuins in HS vs CR PCa cell lines. (Full images of the blots can be found in SI Figure S4.) For all the data shown in this figure, n > 3; n.s., P > 0.5; *P ≤ 0.05; **P ≤ 0.01; ***P ≤ 0.001. (A) Representative immunoblots showing the levels of HATs, PCAF, Gcn5, p300, and acetyl-p300(K1499ac), normalized to the α-tubulin level. (B) Sirtuin levels and quantification for Sirt1–4, 6, and 7 in total cell extract of LNCaP versus C4–2 as normalized to α-tubulin level. The cellular level of Sirt2 and Sirt3 was greatly reduced in C4–2, while the cellular level of other sirutins between the two cell lines was not significant. (Sirt5 was not measured as it displays undetectable deacetylase activity.) (C) Quantitative analysis of SIRT2 mRNA level in LNCaP versus C4–2. The reduction in SIRT2 level in the castrate-resistant (CR) C4–2 cell is consistent with other CR cell lines (DU145) as shown in the SI (Figure S3). (D) SIRT2-dependent deacetylation of acetyl-p300(K1499ac) was shown in both LNCaP and C4–2 after 1 h of incubation with recombinant SIRT2 (r-SIRT2) and NAD+. When LNCaP and C4–2 were not treated with NAD+ and SIRT2, the ac-p300(K1499ac) level was higher in C4–2, while the p300 level remained constant. (E) Sirt2 and Sirt3 protein levels in the whole cell extracts of PCa cell lines (two HS cells, LAPC4 and LNCaP; and four CR cell lines, PC3, DU145, 22RV1, and C4–2) were determined by immunoblots.
