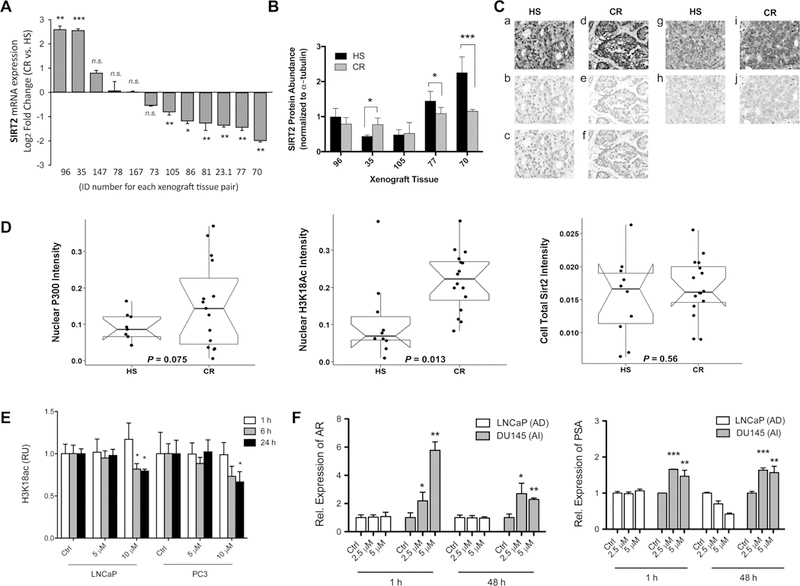
Figure 5.

Changes in the abundance of histone modifiers in HS vs CR human PCa. (A) Sirt2 gene expression is represented by a log2 fold change of CR over HS cells. All of the compared pairs are generated from the same individuals as the tissue progressed from AS to CR by serial xenografts. The bar graph is the average of three technical replicates with standard error represented by s.d. The x axis represents each patient number with at least seven xenografts exhibiting Sirt2 down-regulation in CR. (B) Sirt2 relative protein levels in CR and HS select cells from A. The bar graph is the average of three technical replicates with standard error represented by s.d. (C) Representative staining of HS (a, b, c, g, and h) and CR (d, e, f, i, and j) PCa. Composite images of multiplexed staining are shown in the top panel (a, d, g, and i). Spectral libraries of individual stains were used to segment composite images for quantitative analysis. The selected images demonstrate segmented stains for Sirt2 (b, e), H3K18ac (c, f), and P300 (h, j). These images are representative of the mean intensity of HS and CR PCa for each marker shown (±10% optical density). (D) Box plots of the optical density (OD) of p300, H3K18ac, and Sirt2 immunohistochemistry in HS and CR PCa tissue microarray. Each box represents the 25% to 75% percentile range. Solid horizontal lines represent medians, and notches represent 95% confidence intervals of the medians. Dots represent individual patient tumors in each group. Tissue and cellular segmentation of IHC staining revealed significantly increased nuclear H3K18ac in the epithelium of CR PCa samples (p = 0.013), while epithelial total Sirt2 and nuclear P300 expression did not significantly change in CR vs HS samples. (E) Reduction of the H3K18ac level in C646-treated LNCaP and PC3 cells. At 10 μM C646, both cells showed a decrease in the level of H3K18ac over time as detected by Western blot analysis. Triplicate data were averaged and represented with s.d. The significance of the values was shown using standard convention of p > 0.5, *p ≤ 0.05, **p ≤ 0.01, ***p ≤ 0.001. (F) Changes in the mRNA expression of AR and PSA in PCa cell lines after treatment with C646 up to 48 h are shown. Overall, both AR and PSA showed higher expression after C646 treatment in Du145 cell lines, while LNCaP did not show significant changes compared to the control experiment.
