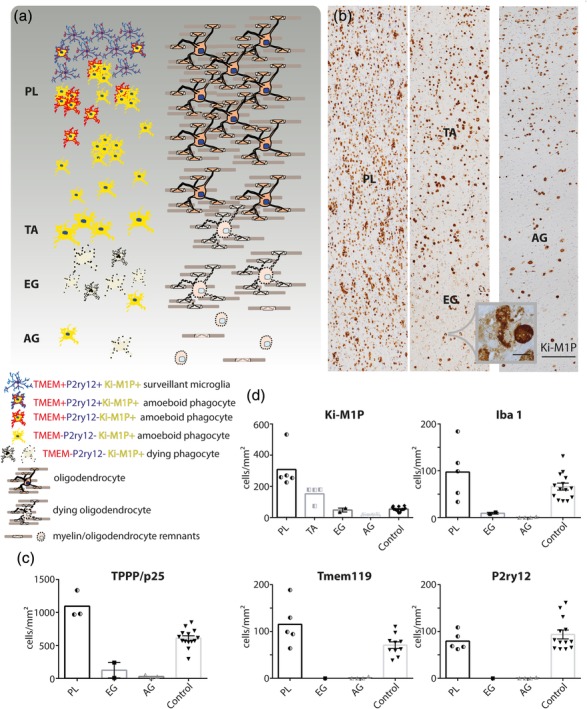
Figure 4.

Lesion evolution in MLD. (a) Schematic representation of phagocyte immune phenotypes and density in relation to myelin and oligodendrocyte pathology. Extended areas of normal appearing white matter, with completely unaltered microglia, were not found in the cases studied. PL = prelesional area; TA = transition area; EG = early gliotic scar; AG = advanced gliotic scar. Left: Overall morphology, size, immune phenotype, and density of phagocytes with indication of membrane destruction and cell death. Right: Corresponding oligodendrocyte and myelin pathology. Oligodendrocyte density was elevated in PL, and, similar to myelin, progressively decreased towards later lesion stages. (b) Patient tissue (LD7) stained with Ki‐M1P. The rightmost panel shows a later stage lesion from a second patient (LD6). Lesion areas are indicated, scale bar: 250 μm. Inset: Phagocyte breakdown in area EG, scale bar: 20 μm. Quantification of (c) TPPP/p25+ mature oligodendrocytes and (d) phagocytes expressing Ki‐M1P, Iba1, Tmem119, and P2ry12 in the different lesion areas. TA was very small and only well discernible in Ki‐M1P IHC; therefore, no quantitation of Iba1, Tmem119, and P2ry12 was performed. Half‐filled symbols represent average cell counts from different lesion areas within one patient (areas PL, TA [LD7]; area AG [LD6]). Filled symbols represent average cell counts from different patients (area EG; controls). The values are cells/mm2
