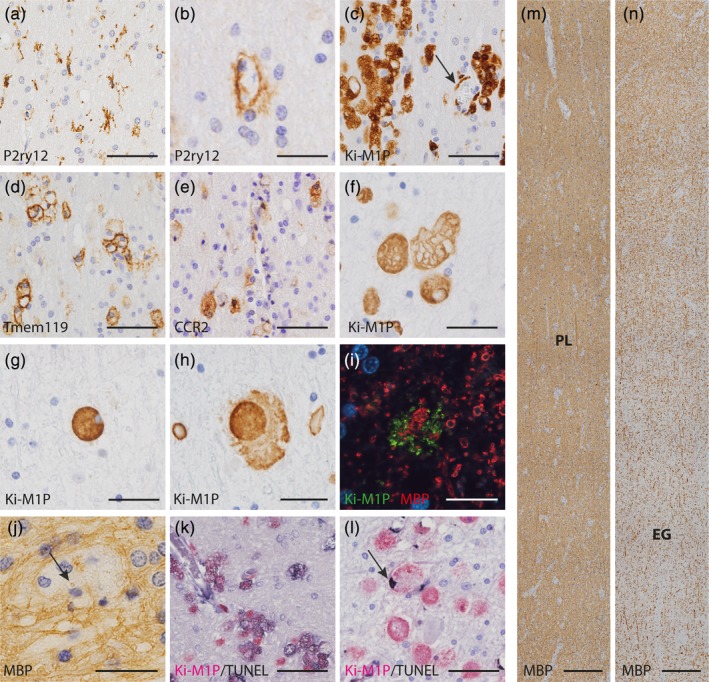
Figure 5.

Microglia and oligodendrocyte pathology in MLD. (a) Exemplary P2ry12+ surveillant microglia and P2ry12+ amoeboid phagocytes (b) in the prelesional area. (c) Clusters of Ki‐M1P+ amoeboid phagocytes in the prelesional area; note that some but not all clusters were associated with vessels (arrow). Cells in clusters partly expressed Tmem119 (d) and partly CCR2 (e). (f–h) Morphological changes in Ki‐M1P immunostained phagocytes in prelesional, transition and early gliotic areas. (f) Enlarged intracellular vesicles, putative lysosomes, lined by Ki‐M1P‐IHC in prelesional areas. In contrast, in the transition area, lysosomal compartments lost their demarcation (g), and phagocytes appeared leaky and disintegrated in early gliotic scar areas (h, see also inset Figure 4b). (i) Indication of recent myelin phagocytosis before phagocyte lysis in early gliotic area. Ki‐M1P+ cell remnants (green) were clustered around MBP+ myelin fragments (red). (j) MBP+ inclusions in phagocytes in prelesional areas (MBP, arrow). (k) TUNEL+ cell death of phagocytes in prelesional area (TUNEL [black], Ki‐M1P [red]) with diffuse cytoplasmic stain. In contrast, in the early gliotic scar area TUNEL reactivity was mostly restricted to the nucleus (l, arrow). (m, n) Myelin diminution in MLD occurred without clear demarcation between prelesional and early gliotic areas (MBP). Lesion areas are indicated on the two consecutive tile scans that show serial sections of tissue depicted in the first two panels in Figure 4b. Scale bar: a, c, d e, k l: 50 μm; b, f–h, j: 25 μm; i: 12.5 μm; m, n: 250 μm
