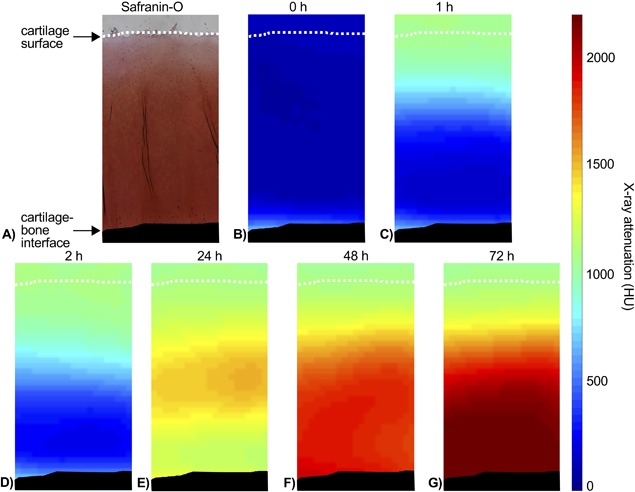
Figure 3.

(A) Light microscopic image of Safranin‐O stained cartilage section. (B) CT image of the same cartilage sample immersed in phosphate buffered saline (PBS). (C–G) CT images of the same cartilage sample after immersion in dual contrast agent for 1, 2, 24, 48, and 72 h. Articular surface is marked with a white dashed line and subchondral bone colored with black.
