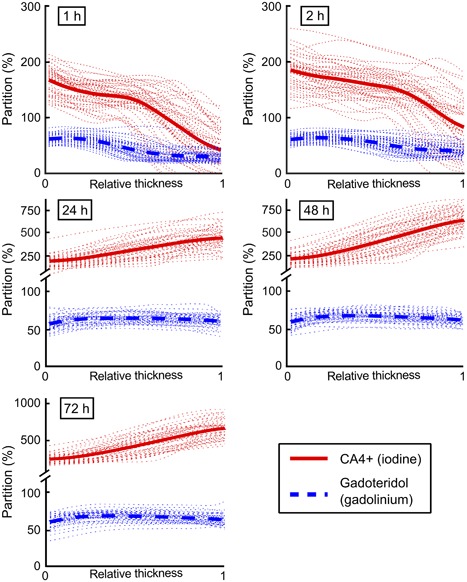
Figure 4.

Sample specific contrast agent partition profiles (n = 45, dotted lines) and mean partition profiles for CA4+ (iodine, solid lines) and gadoteridol (gadolinium, dashed lines) at 1, 2, 24, 48, and 72 h after immersion in the dual contrast agent mixture. In horizontal axis, 0 denotes the articular surface and 1 the cartilage‐bone interface. Please, note axis break and different scaling on vertical axis.
