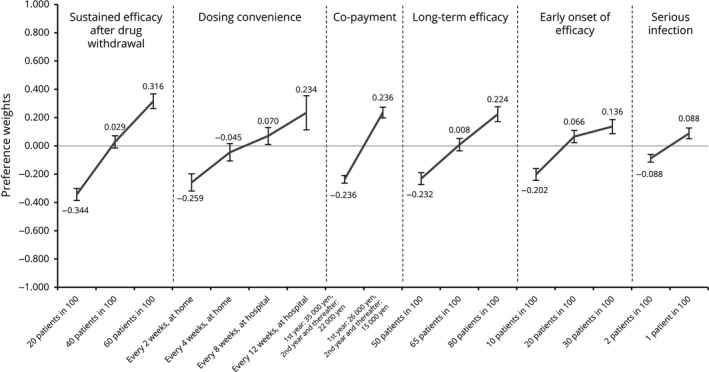
Figure 3.

Preference weights for attribute levels (overall results, n = 395). Preference weights are showed on the vertical scale, describing how much each level was selected within one attribute. Regarding risk of serious infection, one patient in 100 was the highest and therefore the most preferred level in this attribute. Non‐overlapping error bars indicate statistically significant differences across levels within attributes.
