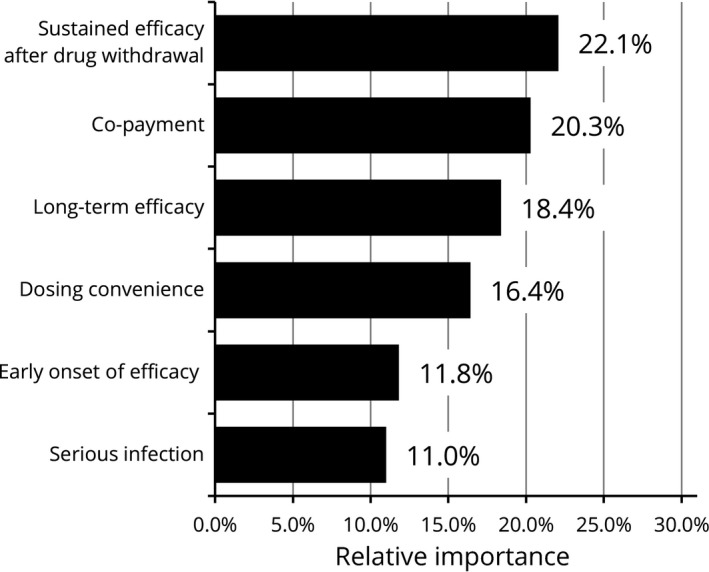
Figure 6.

Relative importance for attributes (≥60 years, n = 139). Relative importance is relatively described values calculated by the distance between the highest and the lowest attribute levels. The higher percentages indicate the more preferred attribute.
