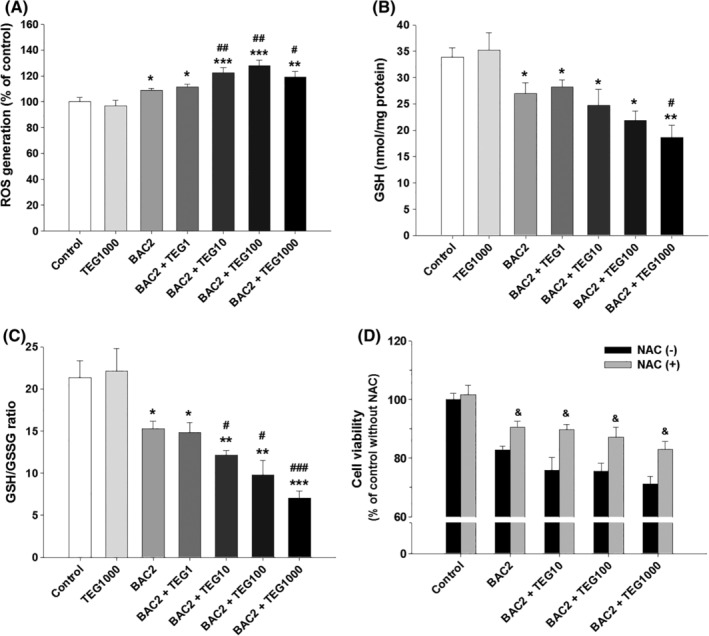
Figure 4.

Oxidative stress induced by the mixtures of BAC and TEG in human alveolar (A549) cells. A, ROS generation. B, Cellular total GSH level. C, GSH/GSSG ratio. D, Cell viability. A549 cells were exposed to BAC (2 μg/mL) with or without TEG (1‐1000 μg/mL) for 24 hours. NAC (1 mM) was treated onto the cells 1 hour before exposure to BAC and TEG. Mean ± SE. Student's t test, *,**,*** P < 0.05, 0.01, and 0.001, respectively, vs control. #,##,### P < 0.05, 0.01, and 0.001, respectively, vs BAC alone. & P < 0.05 vs corresponding group without NAC
