
Figure 5.
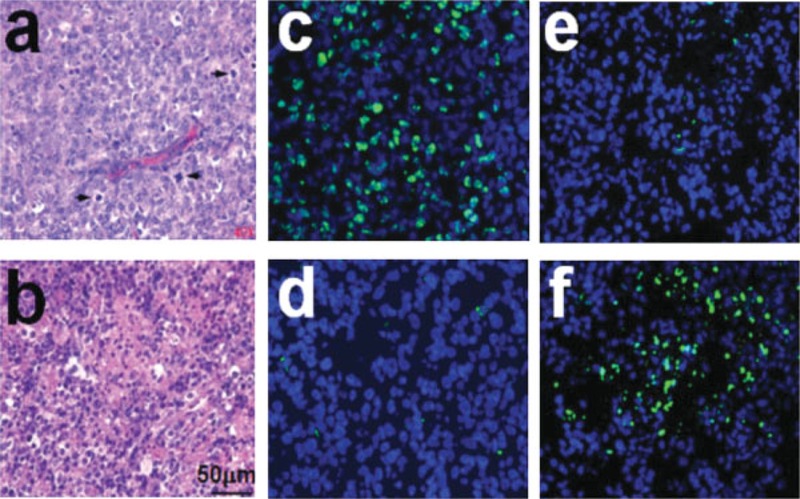
(a,b) H&E-stained micrographs of (a) a control tumor and (b) a CHOPB-treated tumor after four cycles of CHOPB. Arrows indicate mitotic cells. (c,d) Images of Ki67 immunochemical staining of cryosections of (c) a control tumor and (d) a CHOPB-treated tumor after four cycles of CHOPB. (e,f) Images of TUNEL assay of the cryosections of (e) a control tumor and (f) a CHOPB-treated tumor after four cycles of CHOPB. The blue spots in (c) and (d) represent DAPI-stained tumor cells; a green spot indicates an FITC-labeled proliferative tumor cell if it overlays a blue spot. In the TUNEL-treated cryosections (e and f), the blue spots represent DAPI-stained tumor cells; a green spot indicates an FITC-labeled apoptotic cell if it overlays a blue spot.