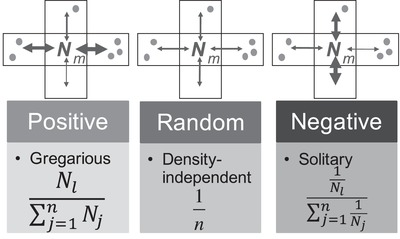
Figure 1.

New models of density‐dependent dispersal implemented in the modified version of SPLATCHE2. The gray dots represent individuals in each neighbor deme. The width of the arrows denotes the amount of migrants sent from the central deme. The migration probability of individuals from deme i to deme l (Pi,l) was considered to be either dependent (negative and positive models) or independent of neighbor densities (random model). The values of j and n represent one of the four available neighbor demes, respectively.
