
Figure 3.
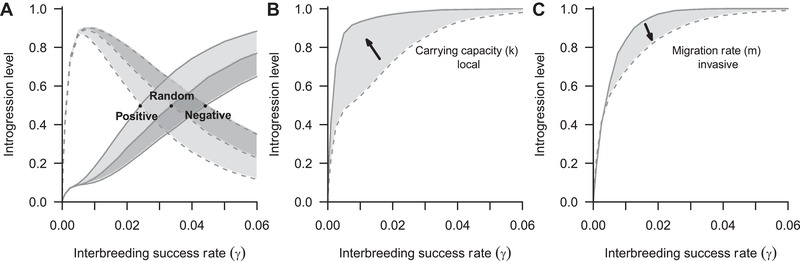
Effect of interbreeding success rate on the proportion of introgressed genes in a theoretical invasive and local species taken from the square world described in Figure 2. (A) Different models of spatial dispersal are presented for both local (dotted lines) and invasive (solid line) organisms (scenario NC4, Table 1); (B) effect of increasing local carrying capacity on the introgression of the invasive species, comparison between scenario NC5 (solid line) and NC1 (dotted line); (C) effect of decreasing migration rate of the invasive organisms on its introgression level, comparison between scenarios NC3 (solid line) and NC2 (dotted line). At the onset of the invasive expansion, the local species occupied the whole area and then interact with the invasive during 1,500 years. Introgression values are average over 10,000 stochastic simulations.