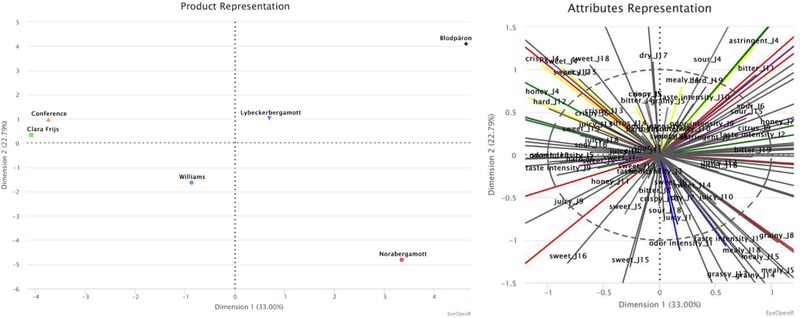
Figure 3.

The pears’ positions are defined, by the first two dimensions by MFA. The first dimension explains 33.00% of the variance, the second dimension 22.79%, 55.79% in total.

The pears’ positions are defined, by the first two dimensions by MFA. The first dimension explains 33.00% of the variance, the second dimension 22.79%, 55.79% in total.