
Figure 2.
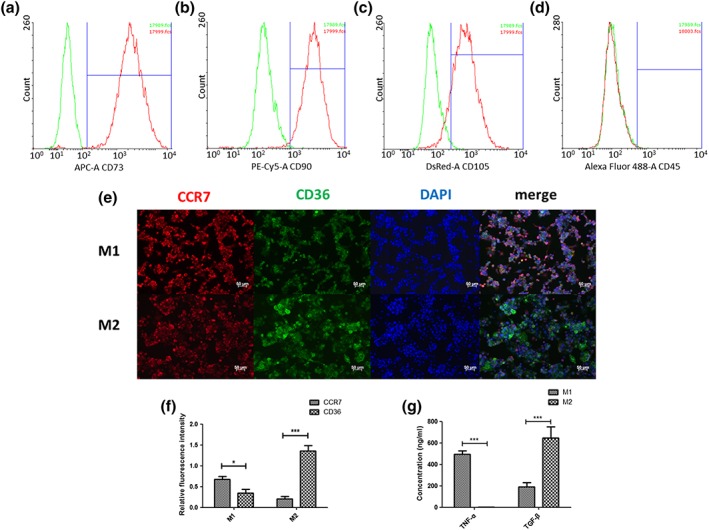
Characterization of adipose‐derived mesenchymal stromal cells (ADMSCs), M1, and M2 macrophages. (a–d) The ratio of positive cells in ADMSCs was compared with the ratio in negative controls. Gates were set using the negative control. Red lines indicate the histogram for ADMSCs markers, and green lines indicate the histogram for negative controls. (e) M1 macrophages and M2 macrophages were stained with M1 marker CCR7 (red), M2marker CD36 (green), and 4′,6‐diamidino‐2‐phenylindole (DAPI) (blue). (f) Quantification of relative fluorescence intensity of CCR7 and CD36 in M1 macrophages and M2 macrophages. (g) The concentration of tumour necrosis factor alpha (TNF‐α) and transforming growth factor β (TGF‐β) in M1 and M2 macrophage culture medium was measured by ELISA. Scale bar, 50 μm. “*” indicates significant difference between groups. *p < 0.05, **p < 0.01, ***p < 0.001 [Colour figure can be viewed at wileyonlinelibrary.com]