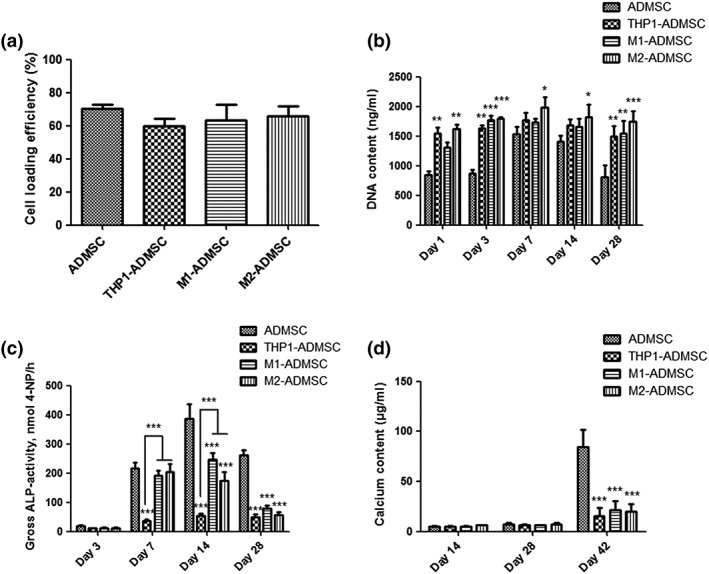
Figure 3.

(a) Cell seeding efficiency in each group. (b) DNA content in each group on Days 1, 3, 7, 14, and 28. (c) Gross alkaline phosphatase (ALP) activity in each group on Days 3, 7, 14, and 28. (d) Calcium content in each group on Days 14, 28, and 42. “*” indicates significant difference compared with the adipose‐derived mesenchymal stromal cell (ADMSC) group at the same time point. *p < 0.05, **p < 0.01, ***p < 0.001
