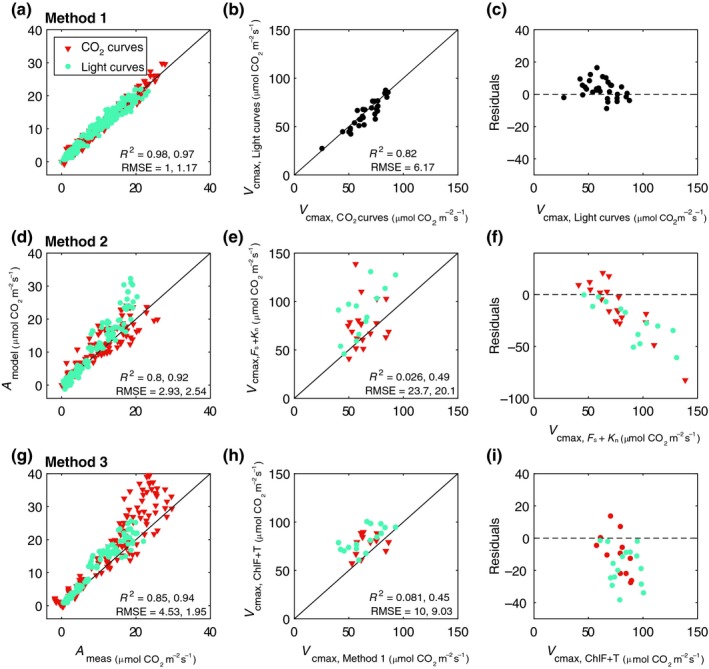
Figure 5.

Maximum carboxylation capacity V cmax and assimilation rate A, estimated with three different methods (a,b,d,e,g,h), together with residuals of predictions (measured minus estimated V cmax, c,f,i). In method 1 (a–c), we compare V cmax retrieved from CO 2‐response curves with the ones retrieved from light‐response curves. In methods 2 (d–f) and 3 (g–i) we compare the V cmax retrieved from either pulse amplitude modulation measurements of steady‐state fluorescence F s and nonphotochemical quenching K n or hyperspectral measurements of Chl fluorescence and transmittance τ, respectively, with the values estimated with method 1. Number of samples (leaves) for CO 2‐ and light‐response curves per method is n m1 = 34/34, n m2 = 19/13, and n m3 = 12/16. Pearson's correlation coefficient R 2 and RMSE are shown per measurements type, CO 2 (red triangles) and light curves (blue circles).
