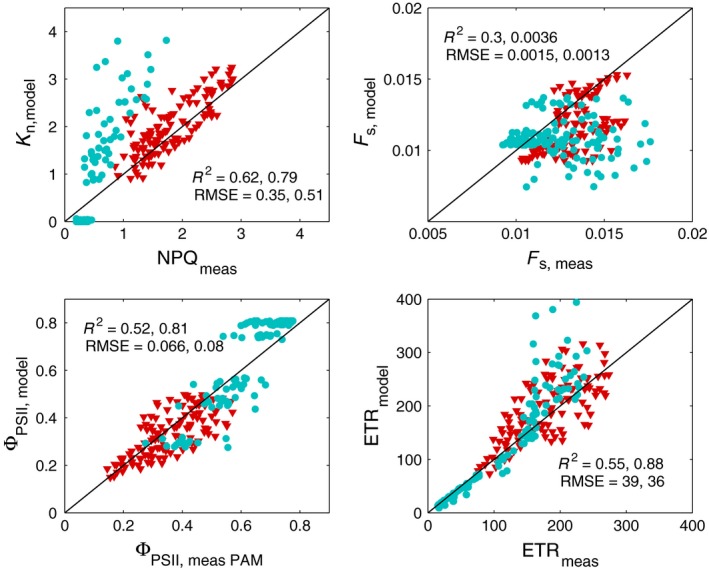
Figure 6.

Modelled vs measured nonphotochemical quenching (K n or NPQ), steady‐state fluorescence F s, quantum efficiency of photosystem II (ΦPSII), and electron transport rate (ETR) for method 3. Pearson's correlation coefficient R 2 and RMSE are shown per measurements type, CO 2 (red triangles) and light curves (blue circles). = 12 and n light = 16.
