
Figure 2.
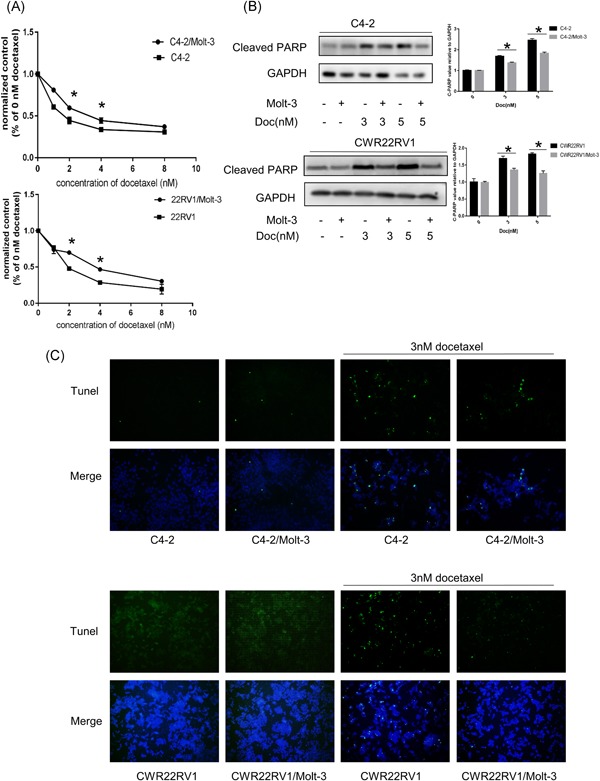
CD4+ T‐cell infiltration in PCa patients with Doc treatment and altered PCa chemotherapy sensitivity. A‐C, Similar results were also obtained when we replaced the HH cells with another CD4+ T‐cell line (Molt‐3 cells). Data are presented as mean ± SD, n = 3. *P < 0.05 vs control. Doc, Docetaxel; GAPDH, glyceraldehyde 3‐phosphate dehydrogenase; PARP, poly ADP ribose polymerase; PCa, prostate cancer [Color figure can be viewed at wileyonlinelibrary.com]