Figure 1.

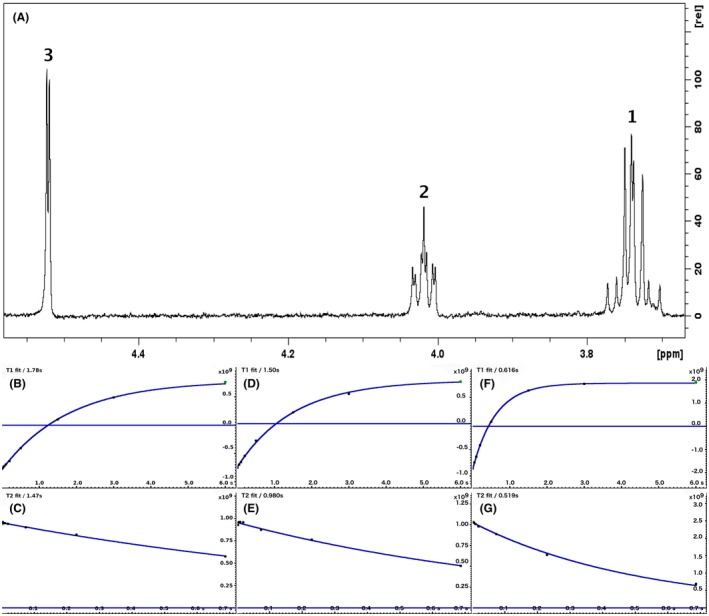
A 500‐MHz 1D 1H CPMG HRMAS spectrum of ascorbate along with graphs showing the measurement of T1 and T2 for the 3 different chemical groups (peak 3 at 4.52 ppm: b and c; peak 2 at 4.02 ppm: d and e; peak 1 at 3.74 ppm: f and g)

A 500‐MHz 1D 1H CPMG HRMAS spectrum of ascorbate along with graphs showing the measurement of T1 and T2 for the 3 different chemical groups (peak 3 at 4.52 ppm: b and c; peak 2 at 4.02 ppm: d and e; peak 1 at 3.74 ppm: f and g)