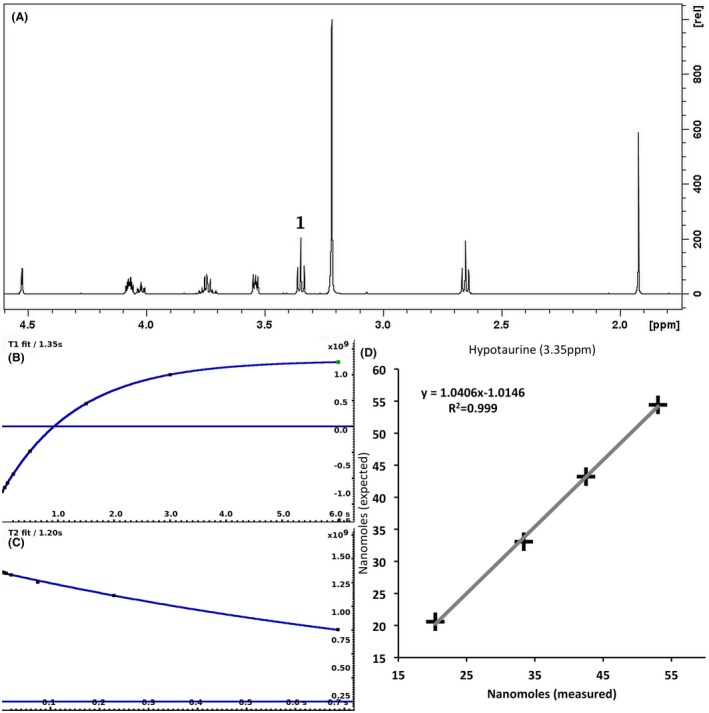
Figure 2.

A 500‐MHz 1D 1H CPMG HRMAS spectrum of a mixture containing 4 metabolites (acetate, ascorbate, choline, and hypotaurine) (A) described in Methods. The measurement of T1 (B) and T2 (C) of hypotaurine at 3.35 ppm is shown. The graph (D) shows the correlation between the number of nanomoles measured and expected in the 4 different solutions for hypotaurine. The nanomoles measured values have been corrected for T1 and T2 effects
