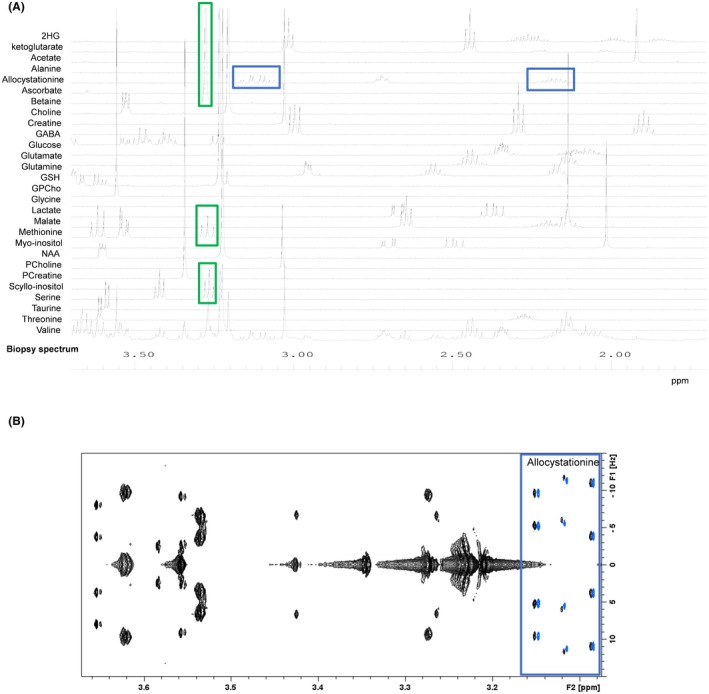
Figure 3.

(A) A 500‐MHz 1D 1H CPMG HRMAS spectrum of a human brain tumor sample (right temporal glioblastoma) and several spectra of the database superimposed on top. The resonances of allocystathionine are highlighted with blue squares. The green squares show the spectral region at 3.3 ppm, where there is a strong signal overlap that will require additional 2D experiments. (B) A 500‐MHz 2D J‐resolved HRMAS spectrum of a human brain tumor sample (right temporal glioblastoma) superimposed with the allocystathionine spectrum (the spectrum has been slightly shifted to the right in order to visualize the good agreement between the peaks)
