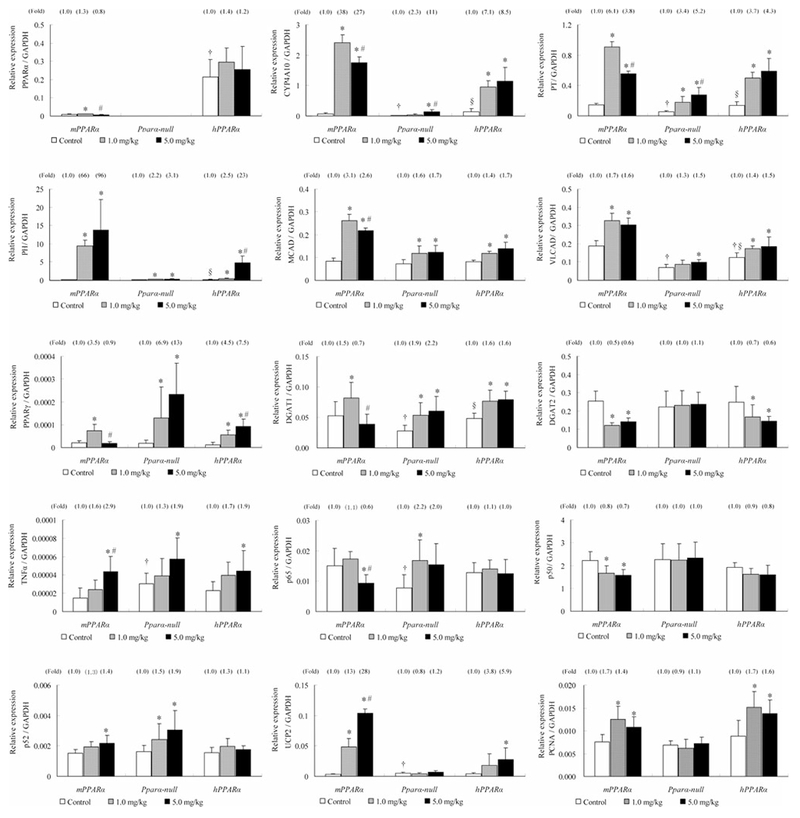
Fig. 2.

mRNA expressions of PPARα and the related genes in livers from mPPARα, Pparα-null and hPPARα mice treated with APFO. Values represent means ± SD for 8–10 mice per group. *Significantly different from respective control (0 mg/kg) group (P < 0.05). #Significantly different from respective low-dose (1.0 mg/kg) group (P < 0.05). †Significantly different from control of mPPARα (P < 0.05). §Significantly different from control of Pparα-null mice (P < 0.05)
