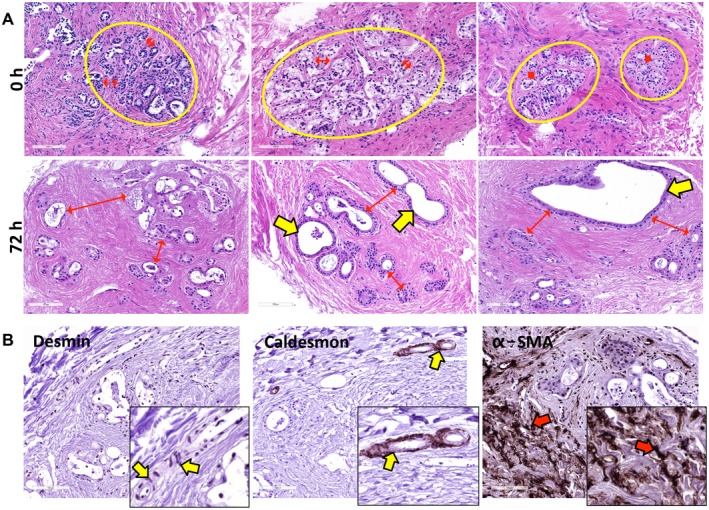
Figure 3.

Stromal and PBG (re‐)organization during incubation. (A) At baseline, small PBG acini were organized in compact clusters (yellow circles) and were located close to each other (red arrows). After 72 hours of incubation, PBG acini showed greater distance between each other (red arrows) and evident dilatation (yellow arrows). (B) Desmin and caldesmon expression was restricted to smooth muscle cells around arteries (yellow arrows); conversely, no expression of these markers was observed in α‐SMA‐positive stromal cells (red arrows). These data confirm that the stromal reorganization around PBG clusters was characterized by α‐SMA‐positive myofibroblasts (red arrows). (B) Original magnification ×20. Abbreviations: α‐SMA, alpha‐smooth muscle actin; h, hours.
