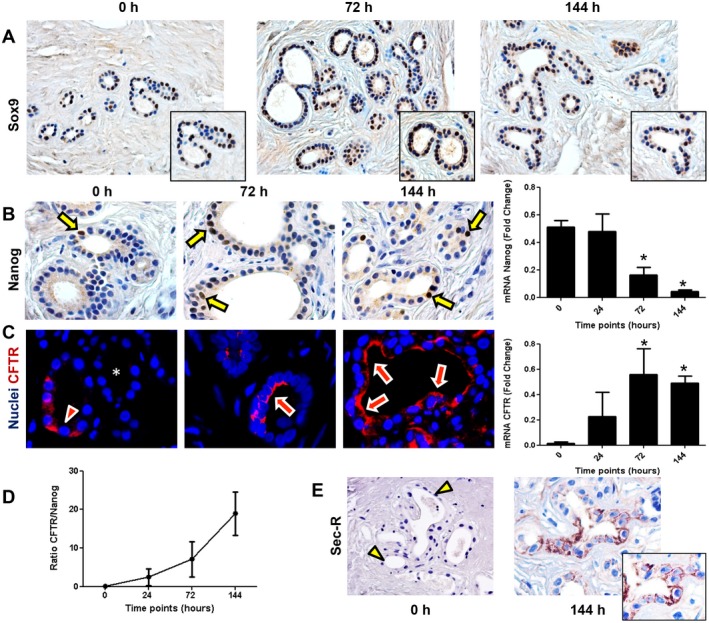
Figure 7.

Cell maturation during 144 hours of oxygenated incubation of bile duct slices. (A) Immunohistochemistry for endoderm progenitor marker Sox9 showed expression in PBG cells at all time points. (B) Immunohistochemistry demonstrated the presence of Nanog‐positive cells at a nuclear level (arrows) within PBG. Only pluripotent and primitive cells expressed Nanog; this cell population decreased over time and was significant lower after 144 hours of incubation (*P < 0.05). (C) Immunofluorescence for CFTR, expressed by mature biliary cells, showed less evident apical expression at baseline (arrowhead) and in some PBG no expression (asterisk) compared with PBG cells after 72 hours and 144 hours of incubation (arrows). Nuclei are displayed in blue. Real‐time quantitative PCR confirmed that CFTR gene expression increased over time and was significant after 144 hours of incubation compared with baseline (*P < 0.05). (D) Ratio between CFTR and Nanog increased during incubation, indicating maturation of the viable cells in the bile duct slices. (E) Immunohistochemistry for Sec‐R. Secretin receptor expression of PBG cells appeared after 144 hours of incubation (arrow). At baseline, PBG were almost negative for secretin receptor (arrowheads). (A,E) Original magnification ×20. (B,C) Original magnification ×40. Abbreviations: h, hours; Sec‐R, secretin receptor.
