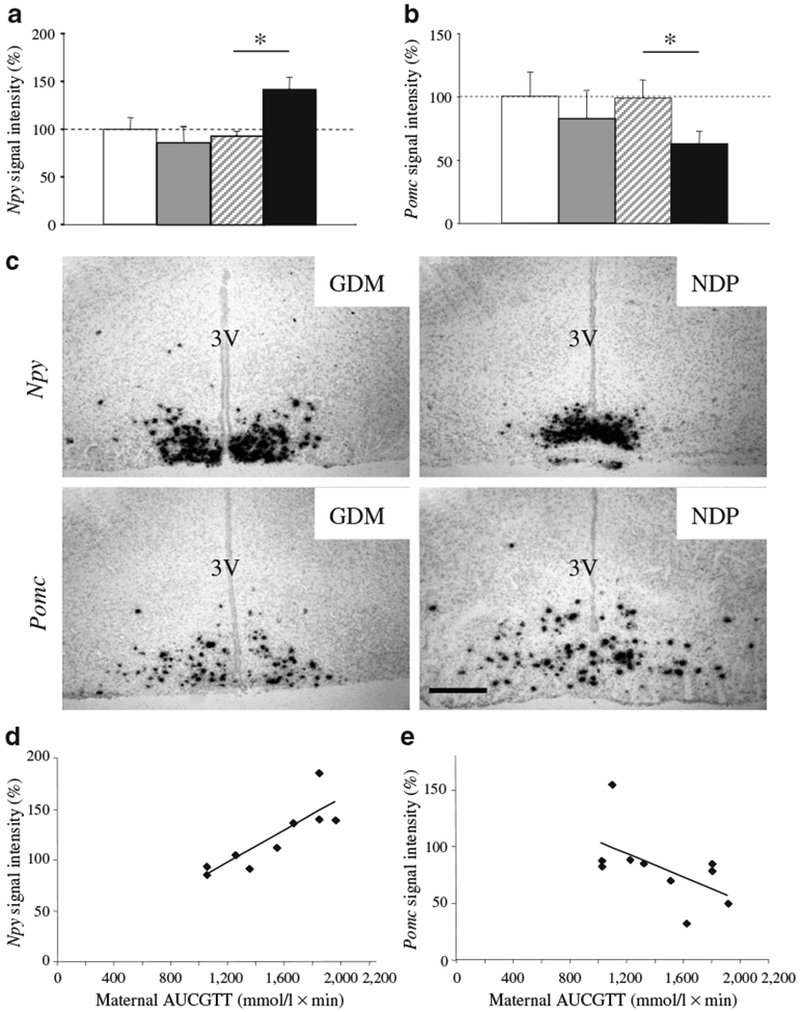
Fig. 7.

Hypothalamic gene expression in offspring. Arcuate hypothalamic expression of (a) Npy and (b) Pomc by in-situ hybridisation. Signal intensity is expressed as a percentage of NDP floxed-control offspring; n=5 per group; *p<0.05 (t test). Bars represent mean±SEM. White bars, floxed-control NDP; grey bars, floxed-control GDM; hatched bars, βArnt NDP; black bars, βArnt GDM. c Representative images of Npy and Pomc in situ hybridisation in βArnt offspring from GDM vs NDP. 3 V, third ventricle. Scale bar, 25 μm. d Correlation between total maternal AUCGTT and hypothalamic Npy expression in βArnt offspring; r2=0.78, p=0.002 (Spearman bivariate correlation). e Correlation between maternal AUCGTT and Pomc expression in βArnt offspring; r2=0.40, p=0.049
