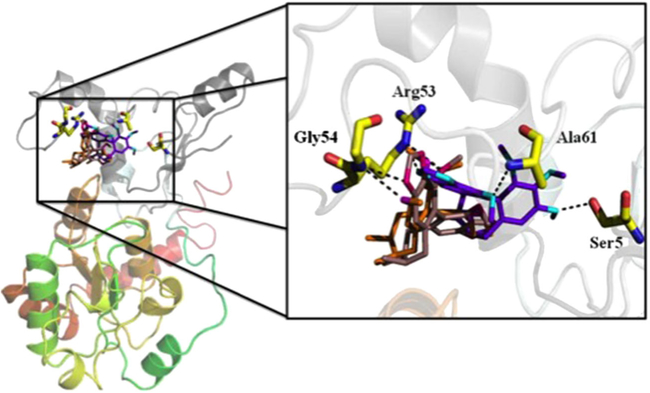
Figure 3.
The UGT1A1 structure in complex with schisandrin A, schisandrin, and schisandrin C. An enlarged representation of the interactions between UGT1A1 and the three inhibitors are demonstrated, and hydrogen bond is shown by a black line. This figure is available in color online at wileyonlinelibrary.com/journal/ptr.

