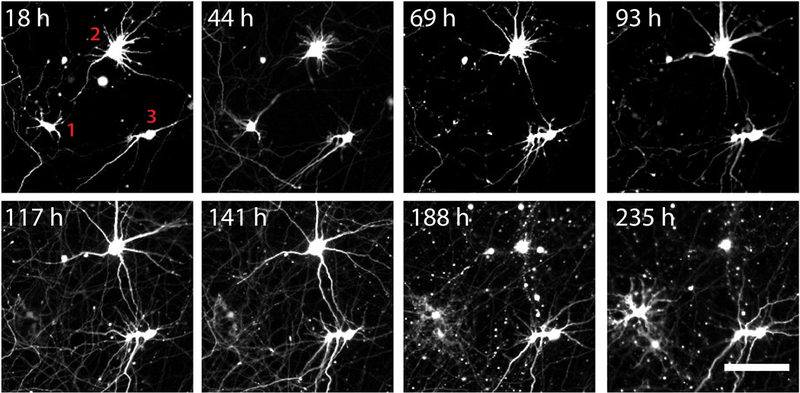
Figure 3: Scoring cell death in transfected rat cortical neurons.

Using the methods described in this article, rat cortical neurons were transfected with a plasmid encoding the fluorescent protein mApple. Cells were then imaged approximately every 24 h, the images were stitched and stacked, and cell death scored using the criteria provided. Cell death is indicated for Neuron 1 at 69 h, as evidenced by loss of fluorescence. Neuron 2 dies at 188 h, as indicated by fragmentation of the processes and rounding of the cell body. Neuron 3 survives for the duration of the experiment. Note that some cells become visible only late in the experiment, as evidenced by the appearance of a new cell at 235 h. Only cells that are visible at the initial time of imaging are included within subsequent analyses. Scale bar = 50 μm.
