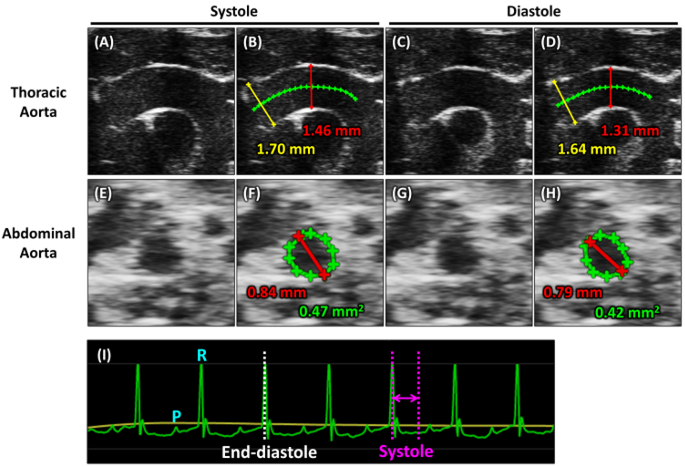
Figure 4: Measurements of aortic images.
Images of the thoracic aorta captured at(A) the midsystole and (C) the end-diastole. Images showing measurements of aortic diameters in the proximal thoracic aortic region during (B) midsystole and (D) diastole. The green line indicates the center of the ascending aorta. The yellow and red lines indicate diameters of the aortic sinus and ascending aorta, respectively. Digits in yellow and red colors indicate actual diameters of the aortic sinus and ascending aorta, respectively. Images of abdominal aorta captured at (E) the midsystole and (G) the end-diastole. Images showing measurements of the suprarenal aorta during (F) midsystole and (H) end-diastole. The red and green lines indicate the diameter and luminal area of the abdominal aorta, respectively. Digits in red and green colors indicate the actual diameter and are of the abdominal aorta, respectively. (I) Monitor electrocardiogram (ECG) recorded during the image acquisitions. The green and yellow lines indicate the ECG and respiratory cycle, respectively. The white dotted line indicates the end-diastole, and the purple line indicates systole. P = P wave and R = R wave. Please click here to view a larger version of this figure.

