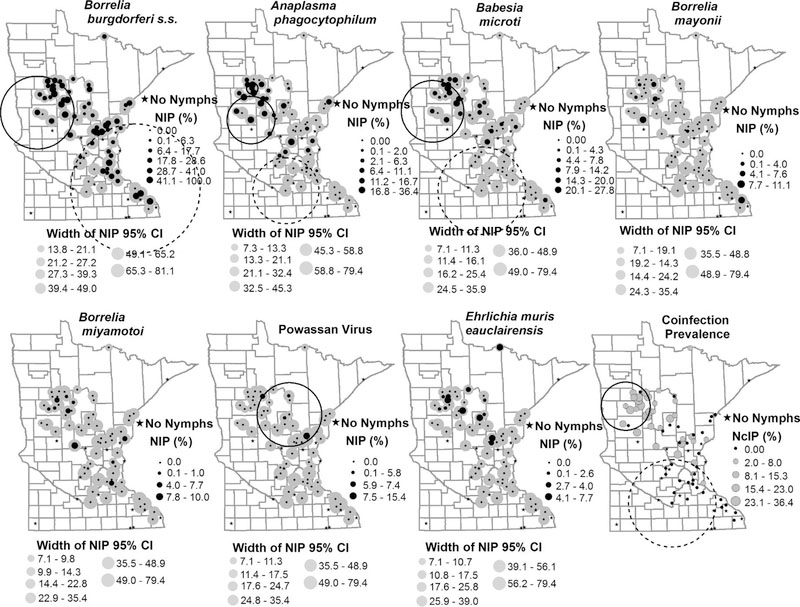
Fig. 2.
Nymphal infection prevalence (NIP) and nymphal coinfection prevalence (NcIP) of Ixodes scapularis collected in Minnesota and tested for seven human disease causing pathogens. Site-specific estimates of NIP are represented by the black dots and the corresponding width of the 95% confidence interval is shown by the grey circles. NcIP is shown by grey circles. Site-specific estimates of NIP and corresponding 95% confidence intervals were calculated using maximum likelihood. Sites encompassed by an large circle represent clusters of sites with high NIP/NcIP (solid black line) and clusters of sites with low NIP/NcIP (dashed line) identified by SaTScan (v 9.4.4).

