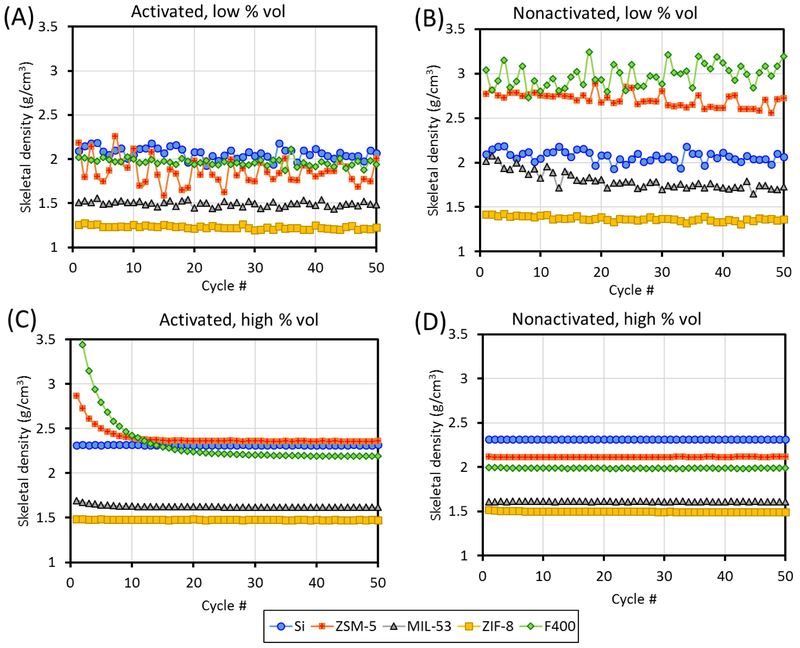
Figure 4.
Representative graphs of helium pycnometry kinetic data for the Si, ZSM-5, F400 carbon, MIL-53, and ZIF-8, in activated and nonactivated forms and at low and high percent fill volume. The data for Si, which was not activated but can be assumed to be free of physisorbed contaminants, is included in panels A and C, for the purpose of comparison only.

