
Extended Data Figure 4 |. Detailed of interactions between sKLB and FGF21CT and conformational changes upon ligand binding.
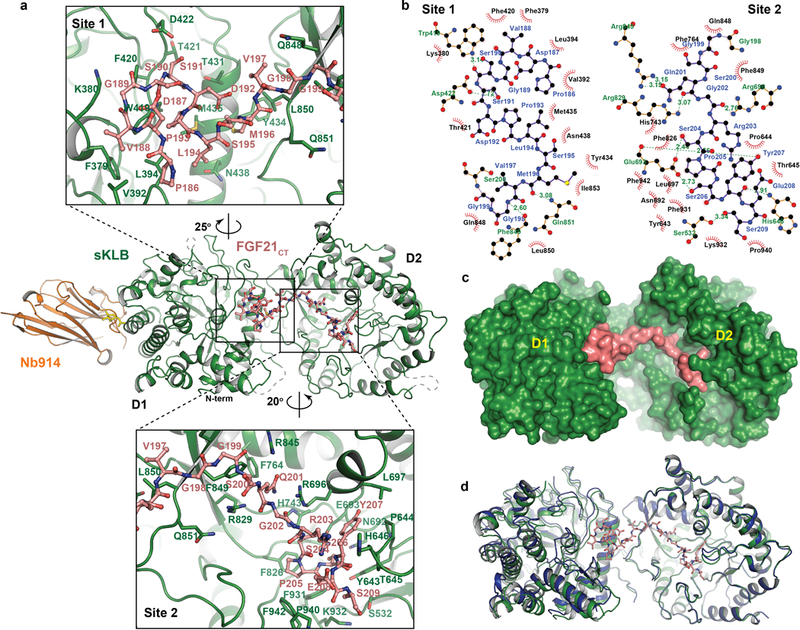
a, Amino acid residues interacting between sKLB (green) and FGF21CT (salmon) in site 1 and site 2 areas are indicated.
b, Diagram of amino acid-specific interactions between sKLB and FGF21CT within site 1 and site 2. The figure was generated using Ligplot+33.
c, Structure of sKLB (green) in complex with FGF21CT (salmon) shown as a surface representation.
d, Structure of ligand-free sKLB (blue) is overlaid onto the structure of sKLB (green) bound to FGF21CT (salmon, ball-and-stick).