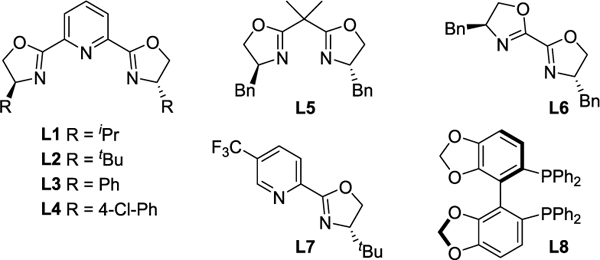
Table 1.
Optimization of E-CuAAC by DKRa
 | |||||
|---|---|---|---|---|---|
| Entry | [Cu] source | Ligand | Temp (°C) | Yield (%) | er |
| 1 | CuI | L1 (2.5%) | rt | 80 | 57:43 |
| 2 | (CuOTf)2PhMe | L1 (2.5%) | rt | >98 | 60:40 |
| 3 | (CuOTf)2FhMe | L2 (2.5%) | rt | 95 | 53:47 |
| 4 | (CuOTf)2PhMe | L3 (2.5%) | rt | 93 | 86:14 |
| 5 | (CuOTf)2PhMe | L4 (2.5%) | rt | 80 | 76:24 |
| 6 | (CuOTf)2PhMe | L5 (2.5%) | rt | 58 | 51:49 |
| 7 | (CuOTf)2PhMe | L6 (2.5%) | rt | 87 | 52:48 |
| 8 | (CuOTf)2PhMe | L7 (2.5%) | rt | 65 | 52:48 |
| 9 | (CuOTf)2PhMe | L8 (2.5%) | rt | >98 | 52:48 |
| 10 | (CuOTf)2PhMe | L4 (5.0%) | rt | 83 | 88:12 |
| 11 | (CuOTf)2PhMe | L4 (5.0%) | 40 | >98 | 99:1 |
| 12 | Cu(MeCN)4PF6 | L4 (5.0%) | 40 | 73 | 90:10 |
| 13 | Cu(MeCN)4BF4 | L4 (5.0%) | 40 | 82 | 91:9 |
Reactions conducted with allylic azide la (0.1 mmol), alkyne 2a (0.12 mmol), in dimethoxyethane (0.2 M), with 2.5 mol% [Cu] and either 2.5 mol% or 5 mol% ligand. Yields based on 1H NMR analysis using 1,3,5-trimethoxybenzene as an internal standard. Chiral HPLC was used to determine er. All yield and er values reflect the average of duplicate trials. See Supporting Information for full details.

