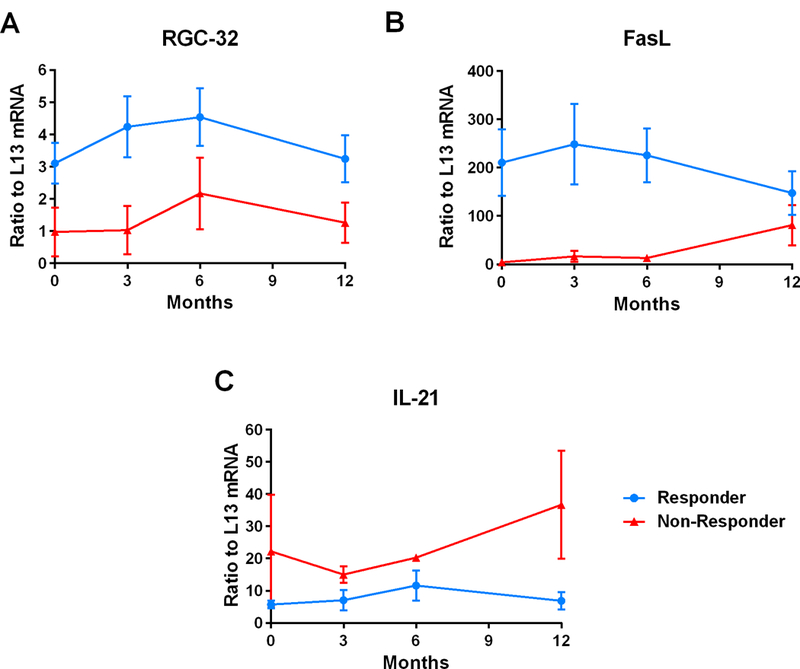
Figure 4. Time course of RGC-32, FasL, and IL-21 mRNA expression in GA-treated MS patients.

PBMCs were obtained from patients with RRMS at 0, 3, 6, and 12 months following the initiation of GA treatment. Target gene mRNA expression was measured in patients’ PBMCs using real-time qRT-PCR and expressed as a ratio to L13. A. Responders to GA showed persistently higher levels of RGC-32 compared to non-responders over time. B. A similar pattern was observed for FasL mRNA expression, with higher levels of mRNA expression seen in responders and lower levels in non-responders over time. C. Responders to GA showed persistently lower levels of IL-21 compared to non-responders over time.
