FIG 3.
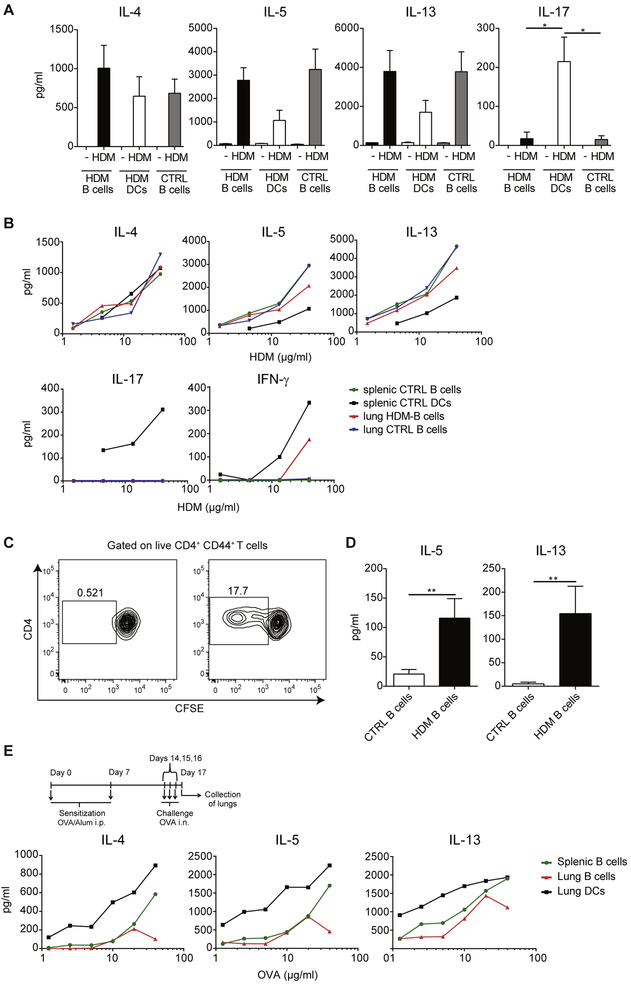
B cells efficiently present HDM antigens to in vivo–primed CD4+CD44+ T cells. A, BALB/c mice were sensitized intranasally with HDM or treated with PBS as a control on days 0, 7, 8, 9, 10, and 11 and analyzed on day 14. Lung B cells and DCs from HDM-treated mice (HDM B cells and HDM DCs, respectively) and splenic B cells from PBS-treated mice (CTRL B cells) were isolated and cocultured with lung CD4+CD44+ T cells from HDM-treated mice in the absence or presence of HDM (40 μg/mL). Graphs show cytokine concentrations in the day 4 culture supernatants measured by means of ELISA. Data are means ± SEMs. B, Splenic B cells or DCs from PBS-treated mice (splenic CTRL B cells and splenic CTRL DCs, respectively) or lung B cells from PBS- or HDM-treated mice (lung CTRL B cells and lung HDM B cells, respectively) were cocultured with lung CD4+CD44+ T cells from HDM-treated mice in the presence of different HDM concentrations. Graphs show cytokine concentrations in the day 4 culture supernatants measured by means of ELISA. IL-21 levels were less than the limit of detection. C and D, To assess whether lung B cells exposed to HDM in vivo carry HDM peptide–MHC complexes on the surface for presentation to T cells, BALB/c mice were treated with HDM or PBS on days 0, 11, 12, and 13, and lung B cells were isolated 24 hours later (day 14). B cells were directly cocultured with CFSE-labeled lung CD4+CD44+ T cells. Representative fluorescence-activated cell sorting (FACS) plots showing the CFSE profile of proliferating T cells (Fig 3, C) and concentrations of IL-5 and IL-13 measured by means of ELISA (Fig 3, D). IL-4, IL-17, and IFN-γ levels were below the limit of detection. E, BALB/c mice were sensitized intraperitoneally with OVA/alum on days 0 and 7 and challenged with OVA protein intranasally on days 14, 15, and 16. On day 17, lung CD4+CD44+ T cells were isolated and cocultured with lung DCs or lung B cells from OVA-treated mice or splenic B cells from PBS-treated mice in the presence of different concentrations of OVA protein. Supernatants were collected 4 days later, and cytokine concentrations were measured by means of ELISA. IFN-γ and IL-21 levels were less than the limit of detection. i.n., Intranasal; i.p., intraperitoneal. Data are representative of at least 3 (Fig 3, A-D) or 2 (Fig 3, E) independent experiments. *P < .05 and **P < .01.

