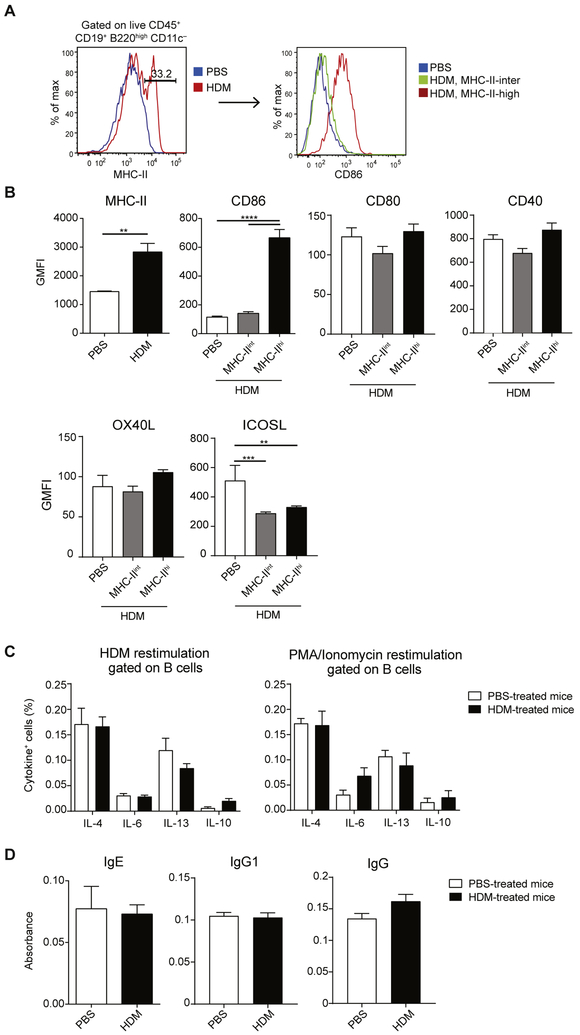
FIG 4.
Lung B cells upregulate MHC class II and CD86 on HDM sensitization. A and B, BALB/c mice were sensitized with HDM or treated with PBS as a control on days 0, 11, 12, and 13 and analyzed on day 14. Fig 4, A, Representative fluorescence-activated cell sorting (FACS) plots of MHC class II expression by total B cells (left) and CD86 expression (right) by total B cells (in PBS-treated mice) or MHC class IIint and MHC class IIhi B cells (in HDM-treated mice). Fig 4, B, Geometric mean fluorescent intensities of MHC class II and different costimulatory molecules (geometric mean fluorescence intensity [GMFI], mean ± SEM) from 5 mice per group. C, BALB/c mice were treated as in Fig 4, A. Lung B cells were restimulated with HDM or phorbol 12-myristate 13-acetate (PMA)/ionomycin in the presence of brefeldin A for 6 hours and analyzed by using intracellular cytokine staining. Graphs illustrate percentages of cytokine-producing B cells (mean ± SEM) from 5 PBS-treated and 5 HDM-treated mice. D, Plasma was collected from HDM- and PBS-treated mice, and HDM-specific IgE, total IgG, and IgG1 levels were measured by means of ELISA. The graph shows ODs (mean ± SEM, n = 5). Data are representative of 4 (Fig 4, A) or 2 (Fig 4, B, -D) independent experiments. **P < .01 and ****p < .0001.

