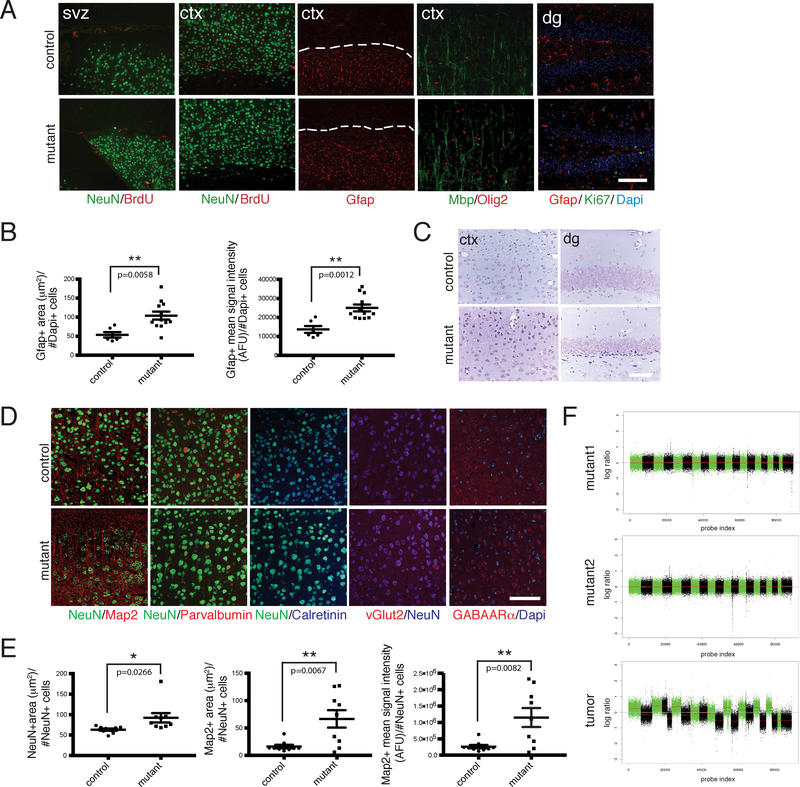
Figure 2. iCK-Cre Mutants Exhibit Astrogliosis and Neuronal Defects.
A. Immunohistochemistry of aged iCK-cre mutant vs. control brain sections using cell type-specific markers Gfap, NeuN, Mbp and Olig2, as well as proliferation markers BrdU (1 hour pulse) and Ki67. Dashed lines show areas with Gfap staining in the cortex. B. Dot plots showing Gfap-positive area (μm2) per number of Dapi-positive cells (left panel; p=0.0058) and Gfap-positive mean signal intensity in AFU (arbitrary fluorescence units) per number of Dapi-positive cells (right panel; p=0.0012) in iCK-cre mutants (n=12) vs. controls (n=6). **p<0.01 using two-tailed unpaired student’s t-test. Data is presented as mean +/− standard error of the mean (SEM). C. Nissl staining of iCK-cre mutant vs. control brain sections. D. Immunoflourescence staining of iCK-cre mutant vs. control brain sections using specialized neuronal markers Map2, Parvalbumin, Calretinin, vGlut2, and GABAARα. E. Quantification of neuronal marker stainings. (Left panel) Dot plot showing the average size of NeuN-positive cells (mean NeuN-positive area per NeuN-positive cell number) in iCK-cre mutants (n=9) vs. controls (n=9). p=0.0266. (Middle panel) Dot plot showing Map2-positive area per NeuN-positive cell number in iCK-cre mutants (n=9) vs. controls (n=9). p=0.0067. (Right panel) Dot plot showing Map2-positive mean signal intensity per NeuN-positive cell number in iCK-cre mutants (n=9) vs. controls (n=9). p=0.0082. *p<0.05, **p<0.01 using two-tailed unpaired Student’s t-test. Data presented as mean +/− SEM. F. Shallow whole genome sequencing of iCK-cre mutants (n=3) compared to controls (n=3). Chromosomal segmentation analysis of mutant recombined brain regions (top 2 panels) and a Synapsin1-cre mutant tumor positive control (bottom panel) showing log ratio of normalized counts between mutant and control on x-axis and probe index on y axis are shown. All scale bars=100 μm. In A and C-D, experiments were independently repeated with similar results at least n=3 times using at least n=3 different mouse tissue samples for each group.

