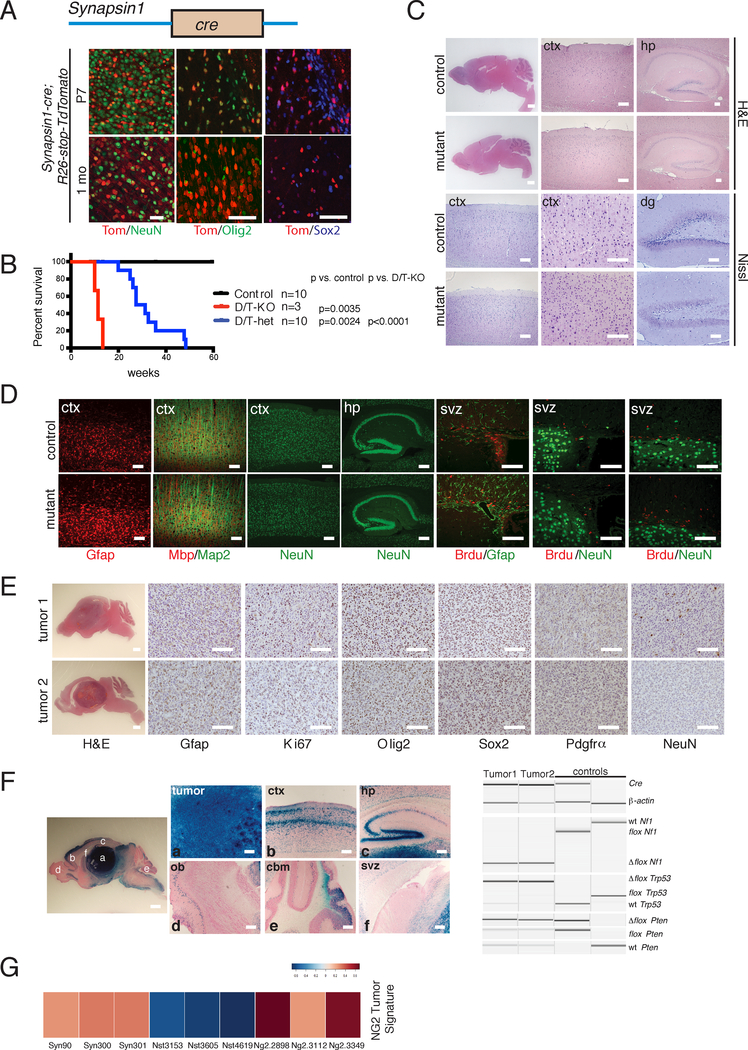
Figure 6. Syn-cre Mutants Exhibit Ectopic Recombination in Neural Progenitors and OPCs.
A. (Top panel) Cartoon of Synapsin1-cre (Syn-cre) construct. (Bottom panel) Immunoflourescence staining of Syn-cre;R26-stop-TdTomato reporter mouse brain using cell lineage markers at P7 and 1 month of age. Scale bars=100 μm. B. Kaplan-Meier survival curve of double/triple knockout (D/T-KO: Syn-cre;Nf1flox/flox;Trp53flox/flox;Ptenflox/+ or Syn-cre;Nf1flox/flox;Trp53flox/flox;Pten+/+; n=3), double/triple heterozygotes (D/T-het: Syn-cre;Nf1flox/+;Trp53flox/+;Ptenflox/+ or Syn-cre;Nf1flox/+; Trp53flox/+;Pten+/+; n=10), and controls (n=10). D/T-KO vs. control: p=0.0035; D/T-het vs. control: p=0.0024; D/T-KO vs. D/T-het: p<0.0001 using Logrank (Mantel-Cox) test. C. H&E and Nissl staining of double/triple knockout mutant brains vs. controls. Scale bars=100 μm except for whole brain=2 mm. D. Immunoflourescence staining of double/triple knockout mutant brains vs. controls using lineage and proliferation markers. Scale bars=100 μm. E. H&E and immunohistochemistry of representative brain tumors using cell lineage and proliferation markers. Scale bars=100 μm except for whole brain=2 mm. F. Recombination of tumor suppressors in Syn-cre Mutants. (Left panel) X-gal staining of a Syn-cre mutant brain section showing different brain regions. (Right panel) PCR genotyping of Syn-cre mutants and controls. Scale bars=100 μm except for whole brain=2 mm. G. Heat map of NG2-creER™ GBM gene expression signature in Syn-cre tumors (n=3, leftmost), as compared with Nestin-creERT2 (n=3, middle) and NG2-creER™ (n=3, rightmost) tumors. In A and C-F, experiments were independently repeated with similar results at least n=3 times using at least n=3 different mouse tissue samples for each group.

