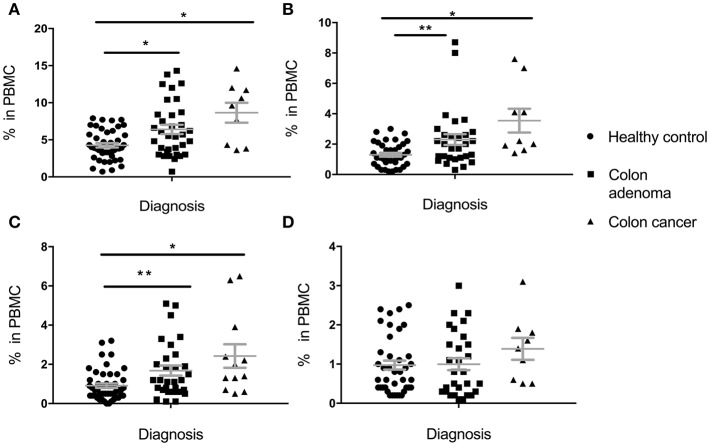
Figure 1.
Levels of circulating total MDSC and various MDSC subpopulations in PBMC of individuals diagnosed with adenomas, compared to healthy individuals and individuals with colon cancer. (A) Total MDSC; (B) PMN-MDSC; (C) M-MDSC; (D) E-MDSC. Each symbol represents a single individual. Mean with SEM bar for each group is shown in grey. *p < 0.05, **p < 0.01.

